Yesterday we looked at the distribution of individual seat swings around the national swing. The short answer is that these swings appear to be normally distributed.
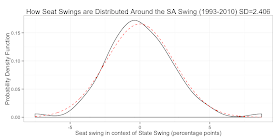
Today, I want to look at distribution of individual seat swings around the swing for the state in which the seat is located. In this process, I have ignored the territories because there are too few seats to analyse. The overall analysis (below) is not as neat as the national picture (above).
Compared to the normal distribution, this distribution is a touch leptokurtic (taller/narrower than the normal curve). Nonetheless, it is probably close enough to the normal curve to use the normal curve in election simulations.
The good news is the reduction is the standard deviation that can be achieved if I am able to estimate the state-by-state swings in real time. That is my next challenge. I am looking at a range of related strategies to achieve this including: Hidden Markov and State Space Models, dynamic linear models and Kalman filters.
For completeness, the the next set of charts is the result for each state. In each the smaller standard deviation is evident.


Mark
ReplyDeleteNot being a political analyst I would like to ask for a bit of clarity on what is the "swing in context of state swing". Its just that I can't quite grasp the terms that are under analysis and how they are being treated.
Thanks
The swing for a state looks at the two party preferred (TPP) vote for Labor and the Coalition this election compared with the previous election. The individual seat swing does the same for seats. I was interested to see how the swing in seats was clustered around the swing for the state.
ReplyDelete