At this point everyone expects Labor to form government following the election. The only question is whether it will be majority or minority government. Based on odds of \$6 (Coalition) and \$1.14 (Labor), the betting market has the probability of a Labor government at 84%. But betting markets must contend with the bookmaker's over-round and the favourite-longshot bias problem. It is reasonable to conclude that most punters think the probability of a Labor win is higher than this.


And, just because we have not done it for a while, let's look at the every seat, first in aggregate, then seat-by-seat. If the favourite got up in every seat, Labor would win majority government with 77 seats.
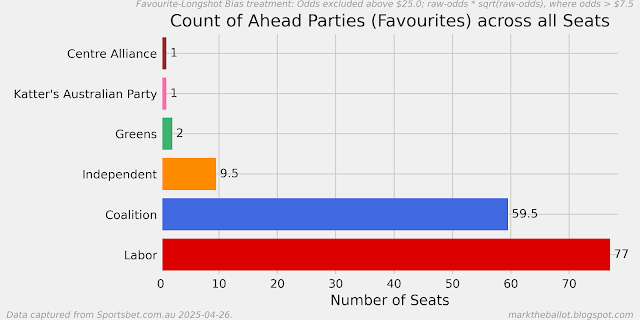
But, if we sum the probabilities we can see the most likely outcome is Labor on 72 seats and minority government.


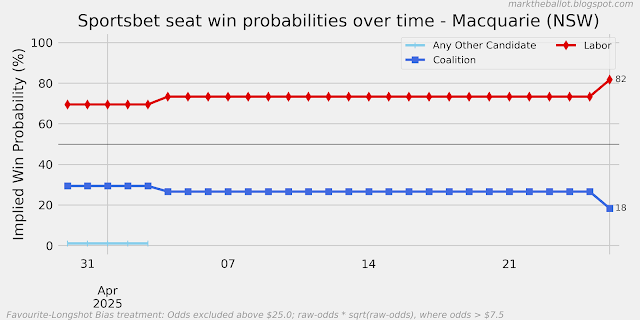
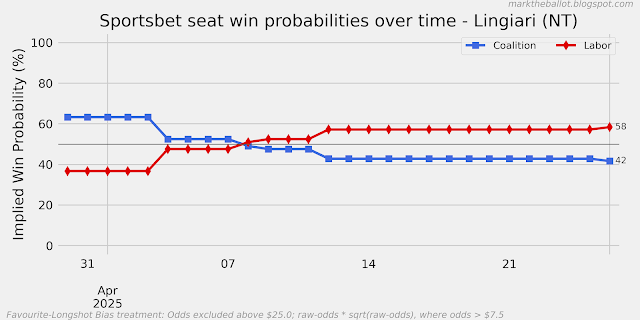
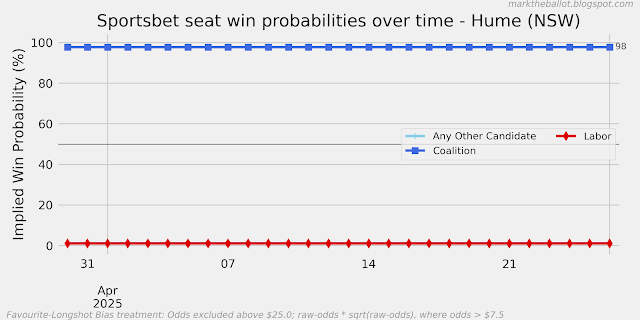
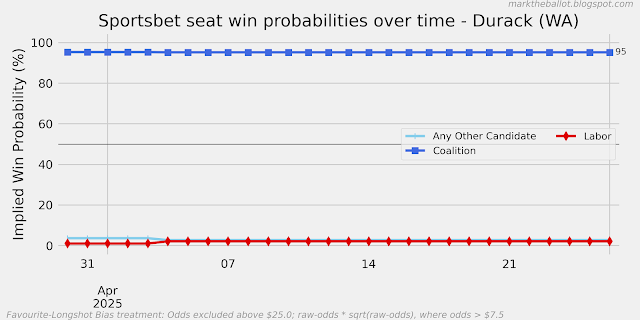
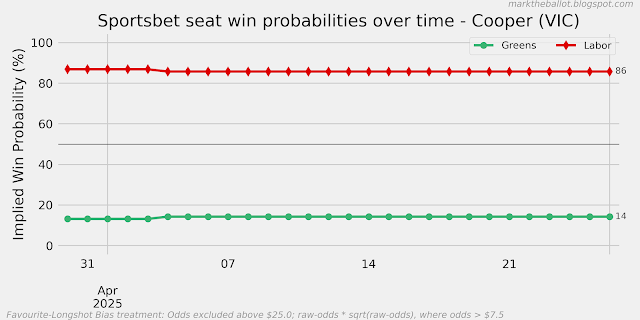
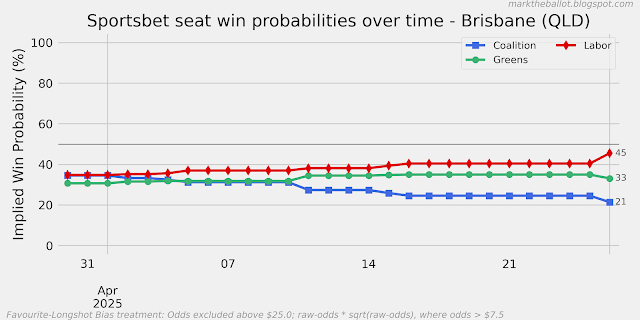
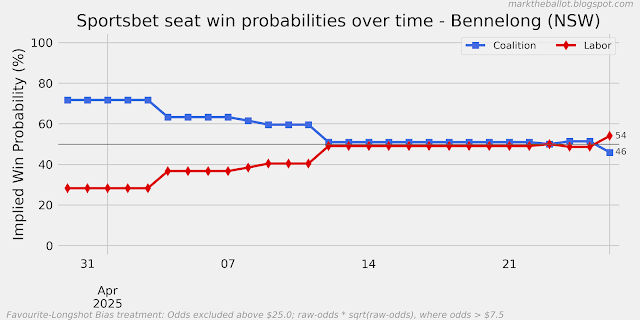
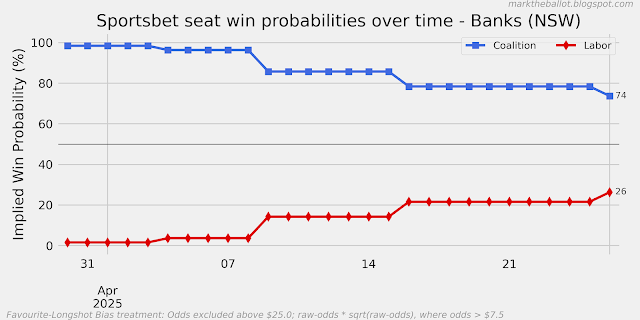
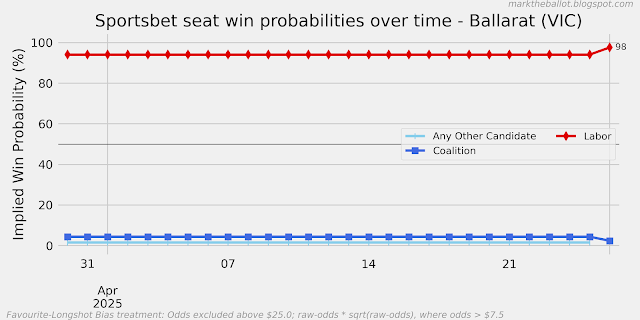
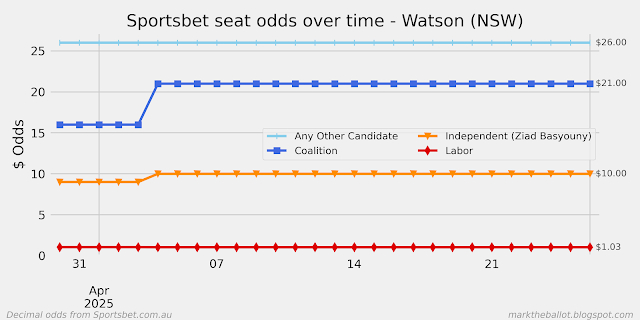
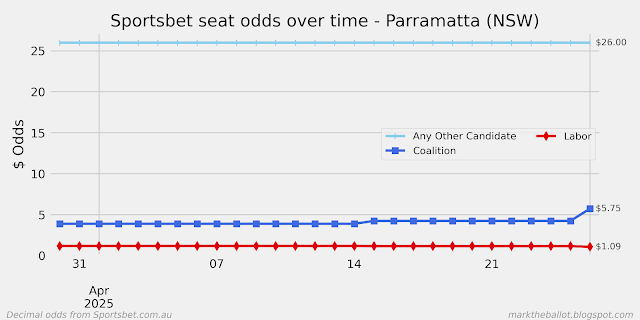
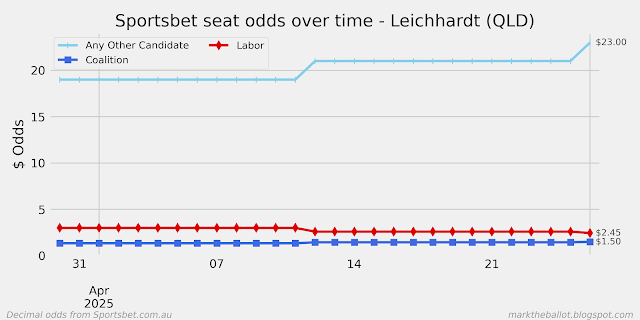
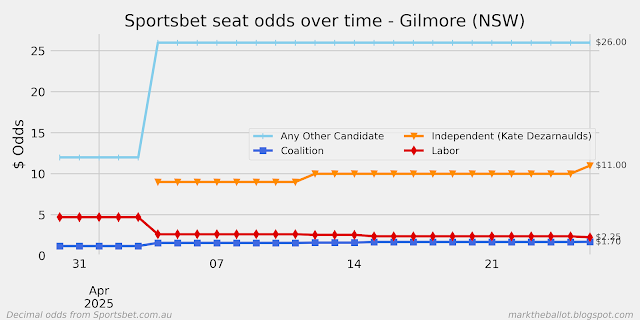
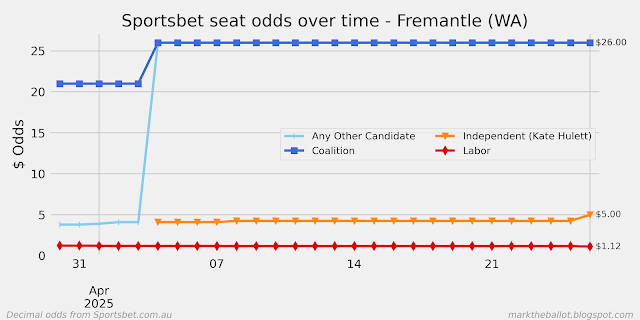
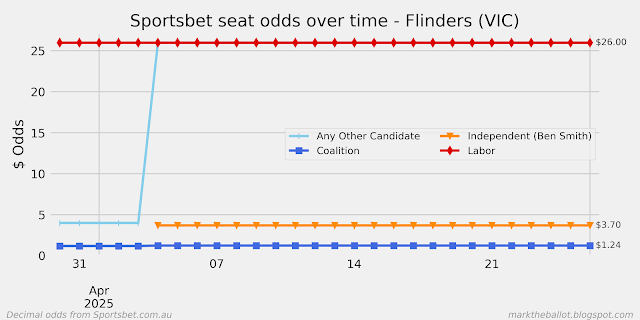
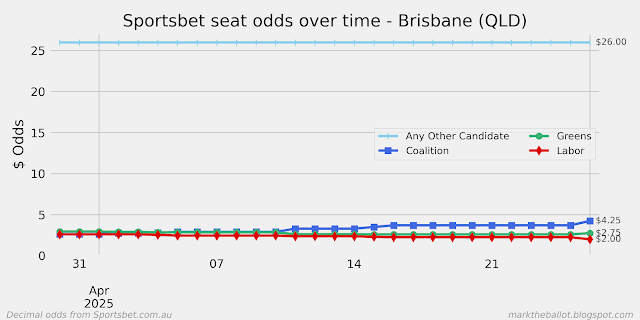
And every seat ...


 |


 |


 |


And the underlying odds ...


And finally, the oddest chart I produce, which lets me know that I captured all odds for all seats this morning. It is a much more elongated shape when I don't collect every odd for every seat.


That is indeed an odd plot. How does it work?
ReplyDeleteIt is a Kernel Density Estimate plot of the bookmakers over-round for all 150 seats. Missing odds show up with an over-round below about 1.07.
ReplyDeleteThanx. Shapes are interesting.
ReplyDelete