Normally, when thinking about the accuracy of polling houses we would look at past performance. However, most Australian pollsters are relatively new. Even the long-standing names have been subject to mergers and acquisitions over recent years. There is just not enough history to come to a clear view about polling accuracy.
Rather than look to the historical performance of the polling houses, I wondered whether - for each pollster - we could compare them with the aggregation of all the polls excluding that pollster (a leave one out or LOO analysis). We can then look at the Root Mean Square Error (RMSE) for each pollster compared with their peers.
Rather than remove each house from the model one-by-one, I changed the model so that polls from the "left-one-out" pollster reflected the population outcome with a standard deviation of 10 percentage points (roughly equivalent to a poll with a sample size of 30) . The other polls were treated as if they had a standard deviation of 1.6 percentage points (or a sample size of 1000).
This largely removed the influence of the LOO pollster in establishing the aggregate. However, it meant that we could calculate a median house bias, which we applied before assessing the degree of error for each polling house (after all, I was interested in noisiness of a pollster, not its unadjusted house bias). My medium term intention is to pare back the influence of noisy pollsters on the model.
Let's look at the analysis for each pollster. being treated as uninfluential. On these charts, LOO stands for the "left one out".
Yes the differences are small. But they are also meaningful. For example, the inclusion of Ipsos drives a dip in the analysis immediately before the Turnbull/Morrison change over. No other pollster has such a dip.
Turning to the RMSE analysis: this supports the hypothesis that Ipsos is noisier than the other polling houses. For each poll I took the difference between bias adjusted poll result and the aggregate estimate on the day of the poll (in percentage points). N is the number of polls for each pollster. The mean is the mean difference. I was expecting the mean difference to be close to zero, with the differences normally distributed around zero. The standard deviation is the classical standard deviation for all of the differences. RMSE is the square root of the mean squared differences.
| N | mean difference | std dev | RMSE | |
|---|---|---|---|---|
| Essential | 70.0 | -0.095937 | 0.885413 | 0.884211 |
| Ipsos | 12.0 | -0.423814 | 1.497985 | 1.556784 |
| Newspoll2 | 21.0 | -0.147582 | 1.129458 | 1.139059 |
| Roy Morgan | 5.0 | 0.290956 | 1.047105 | 1.086777 |
| ReachTEL | 13.0 | -0.001811 | 0.932127 | 0.932129 |
| YouGov | 9.0 | 0.284016 | 1.210048 | 1.242933 |
| Newspoll | 25.0 | 0.021968 | 0.897288 | 0.897557 |
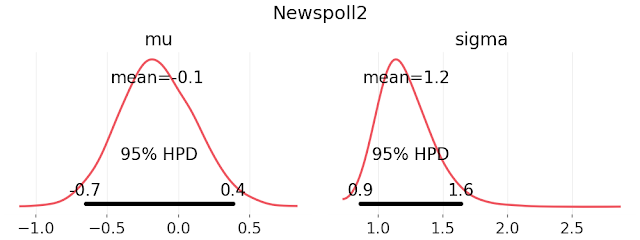
Because I am a Bayesian, I can use the difference data and a prior normal model to reconstruct the distribution of differences for each pollster. This yields the following parameter distributions for the difference between bias adjusted poll results and the aggregate population estimate. Again, Ipsos appears to be the noisiest of the pollsters.
For completeness, the Stan code I used in estimating the mean (mu) and standard deviation (sigma) for the difference in bias adjusted poll results when compared with the aggregate estimate from the other pollsters follows.
// STAN: Bayesian Fit a Normal Distribution
data {
    int<lower=1> N;
    vector[N] y;
}
parameters {
    real<lower=0> sigma;
    real mu;
}
model {
    sigma ~ cauchy(0, 5);
    mu ~ cauchy(0, 5);
    y ~ normal(mu, sigma);
}
In terms of the model, for the more noisy pollsters, I plan to increase the noise term in the model (using the vector poll_qual_adj). In effect these pollsters will be treated as having a smaller sample size. The updated model follows.
// STAN: Two-Party Preferred (TPP) Vote Intention Model
//     - Updated to allow for a discontinuity event (Turnbull -> Morrison)
//     - Updated to exclude some houses from the sum to zero constraint
//     - Updated to reduce the influence of the noisier polling houses

data {
    // data size
    int<lower=1> n_polls;
    int<lower=1> n_days;
    int<lower=1> n_houses;

    // assumed standard deviation for all polls
    real<lower=0> pseudoSampleSigma;

    // poll data
    vector<lower=0,upper=1>[n_polls] y; // TPP vote share
    int<lower=1> house[n_polls];
    int<lower=1> day[n_polls];
    vector<lower=0> [n_polls] poll_qual_adj; // poll quality adjustment

    // period of discontinuity event
    int<lower=1,upper=n_days> discontinuity;
    int<lower=1,upper=n_days> stability;

    // exclude final n houses from the house
    // effects sum to zero constraint.
    int<lower=0> n_exclude;
}

transformed data {
    // fixed day-to-day standard deviation
    real sigma = 0.0015;
    real sigma_volatile = 0.0045;
    int<lower=1> n_include = (n_houses - n_exclude);
}

parameters {
    vector[n_days] hidden_vote_share;
    vector[n_houses] pHouseEffects;
}

transformed parameters {
    vector[n_houses] houseEffect;
    houseEffect[1:n_houses] = pHouseEffects[1:n_houses] -
        mean(pHouseEffects[1:n_include]);
}

model {
    // -- temporal model [this is the hidden state-space model]
    hidden_vote_share[1] ~ normal(0.5, 0.15); // PRIOR
    hidden_vote_share[discontinuity] ~ normal(0.5, 0.15); // PRIOR
    hidden_vote_share[2:(discontinuity-1)] ~
        normal(hidden_vote_share[1:(discontinuity-2)], sigma);
    hidden_vote_share[(discontinuity+1):stability] ~
        normal(hidden_vote_share[discontinuity:(stability-1)], sigma_volatile);
    hidden_vote_share[(stability+1):n_days] ~
        normal(hidden_vote_share[stability:(n_days-1)], sigma);

    // -- house effects model
    pHouseEffects ~ normal(0, 0.08); // PRIOR

    // -- observed data / measurement model
    y ~ normal(houseEffect[house] + hidden_vote_share[day],
        pseudoSampleSigma + poll_qual_adj);
}
The updated charts follow.


No comments:
Post a Comment