I am now applying the same Bayesian aggregation techniques I use to the opinion polling. I wrote extensively about those techniques here. The results are as follows:
Albanese - preferred leader

I am now applying the same Bayesian aggregation techniques I use to the opinion polling. I wrote extensively about those techniques here. The results are as follows:
Now that we have enough data (around 40 national polls since the last election), we can start looking at a Bayesian aggregation using a Gaussian random walk to estimate voting intention from day to day. I will tease with the chart that intrigues me the most: the rise of the One Nation Party since the 2025 election.
It's time for another polling update. We will start with the primary voting intention polls. Of note, there is a substantial divergence between polling firms. In the last couple of weeks we can see one pollster with the Coalition primary vote share at 24 per cent and another at 33. On the other side of the fence one pollster had Labor's primary vote share at 33 per cent and another over 38 per cent.
Overall, the Greens and Others are little changed since the election. Labor's post election honeymoon may be coming to an end. The Coalition's post-election decline may be stalling. One Nation's post-election renaissance may be slowing. However all of these observations are couched in the context of very noisy and somewhat contradictory voting intention data from the various polling firms.

The remarkable thing in the latest batch of polls is the continued rise of the One Nation Party.


There are two posts this morning. This is the betting market post, and separately there is a polls update.
At 6.30am this morning, the betting market at Sportsbet was firmly of the view that the Labor Party will provide the Prime Minister in the new Parliament. The odds for a Coalition win were \$9.30 (down from \$11.00 yesterday). The odds for a Labor win were \$1.08 (up from \$1.06 yesterday). The probability of a Labor win was 89.6 per cent - down from 91.2 per cent yesterday.

There are two posts this morning. This is the polls post, and separately there is a betting market update.
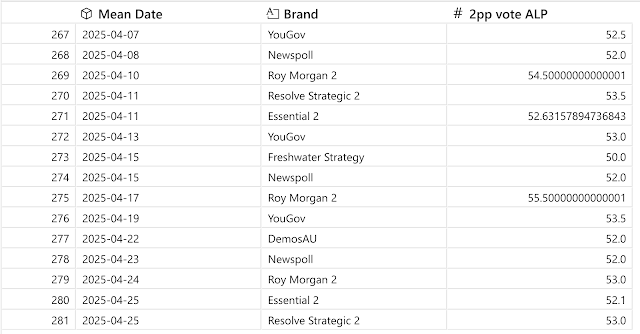
There is an abundance of new polls today, each with the following two-party preferred (2pp) population estimate:

The election is tomorrow! Today we have two more polls: Freshwater strategy 51.5/48.5 to Labor, and DemosAU 51/49 to Labor. The aggregation remains unchanged.

It looks like we are seeing some poll-herding in the lead-up to 2025 Election. Since yesterday's blog post, two more polls were released in the 52 to 53 per cent range for Labor. It is clear that most polls since the beginning of April are narrowly dispersed in the 52 to 53 per cent range on the two-party preferred metric for Labor.
One outlier from the narrow 52/53 trend was a Freshwater poll on 15 April which had the race at 50/50. Freshwater Strategy polls typically have the Labor vote lower than the other polls. Two outliers come from Roy Morgan: 54.5 on 10 April and 55.5 on 17 April. In recent months, Roy Morgan has typically had Labor above the trend of the other polls. A further outlier comes from Resolve Strategic with Labor on 53.5 on 11 April. And a final outlier comes from YouGov with 53.5 on 19 April.

Today we will look at a couple of new polls, and at the betting market.
Today there are two new polls to report: Roy Morgan on 53/47 to Labor, and Demos on 52/48 to Labor.

Today we have a new Newspoll (52/48) in Labor's favour. The Bayesian aggregation is unchanged. We are looking at a result much like the previous election if the polls are correct.

At this point everyone expects Labor to form government following the election. The only question is whether it will be majority or minority government. Based on odds of \$6 (Coalition) and \$1.14 (Labor), the betting market has the probability of a Labor government at 84%. But betting markets must contend with the bookmaker's over-round and the favourite-longshot bias problem. It is reasonable to conclude that most punters think the probability of a Labor win is higher than this.

We are four weeks into the 2025 election campaign, In a week and a day we will be voting. Yesterday we had a YouGov poll which placed Labor on 53.5 per cent of the two party preferred vote (2pp). My aggregation now has Labor on 52.2 per cent of the 2pp.

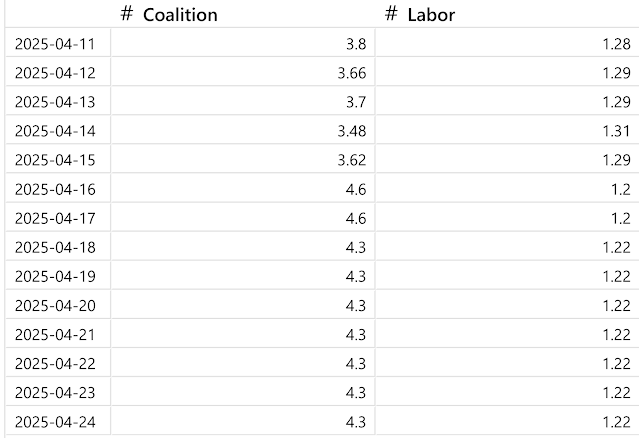
The betting market has been remarkably quiet over the past week. What follows is the table of raw odds in dollars for the party to provide the Prime Minister after the next election. I collect this data each day at around 6.30am (local Canberra time). Normally, this close to an election, the odds change every day.
Yesterday Roy Morgan published a new poll with Labor on 55.5 per cent of the two-party preferred (2pp) vote. If repeated at an election, this would be a huge and historic landslide win for Labor. However, in recent months Morgan has been substantially more favourable to Labor than other pollsters, and as a consequence this poll result has had little impact on my polling aggregate, which now has Labor on 52 per cent of the two-party preferred vote (ie. if the polls and aggregation are correct, we are looking at an outcome similar to the 2022 election).

Early voting begins today. You can use this link to find out where to vote (the information on early voting is towards the bottom of the page).
Today there were no new polls, and little change on the betting market. So lets take the time to look at the independents that the punters think will be elected. I will rank each seat according to the probabilities the punters give to an independent win.
What is interesting to note:

We have another Newspoll, in which Labor has a two-party preferred (2pp) vote share of 52 per cent (which is the same result as the previous two Newspolls). This is effectively the same result as the previous election (52.13 per cent for Labor). When I aggregate the pollster estimates, I get 51.9 per cent for Labor.

This morning, the betting market had a Labor government at an 78% probability after the election.

I have been refining my code for the individual seats market at Sportsbet.com.au. Before we get to the charts for every seat, let me take you through the changes I have made.
Occasionally, Sportsbet suspends odds for a particular candidate in a seat, and sometimes it even removes an entire seat from the market for a few days. This morning, there were no odds at all for the seat of Franklin in Tasmania. Furthermore, the odds for a candidate in each of the seats of Bendigo (Vic) and Lyons (Tas) were suspended. In each of these cases I use the most recent odds available to calculate seat probabilities. However, to be transparent, when this occurs I add a grey bar to the seat probabilities chart.
Second, I have changed the way I manage the favourite-longshot bias problem. Before I explain these changes, I need to explain why I do this. Counting favourites from each seat does not give a good picture of the Parliament that is likely to emerge. A better picture of the likely Parliament comes from summing the probabilities. But when I sum the simple probabilities, because of the favourite-longshot bias problem, I do not get enough Labor and Coalition seats (the typical favourites), and I get far too many seats for "any other candidate" (the long shot).
To address this bias, I treat odds up to \$7.50 normally (ie. for probabilities greater than roughly 15 per cent after the bookmaker's overround). I inflate odds between \$7.50 and \$25 by multiplying them by their square root, this reduces the associated longer shot probability. Finally, I ignore odds over \$25. In many seats, the odds for any other candidate are set at \$26 (fairer odds in many of these cases might approach \$1000).
With that aside, let's look at the likely Parliament according to the punters.

Today marks three weeks since the election was called. It is two weeks and one day until the election on 3 May.
Yesterday we had a Freshwater poll, which had the race at a 50/50 tie on the two party preferred (2pp) metric. It is worth noting that my model observes a house effect for Freshwater of 1.3 percentage points away from Labor 2pp. My model has Labor on 51.7 per cent of the 2pp vote.


It is unusual for a second term government to outperform its first term 2pp vote share. Today's polls suggest it might be possible for this Labor government.


Not a lot to report today. The betting market sees it much as it did yesterday.

Today the individual seats market has Labor ahead (the favourite) in 75 seats. But the sum of probabilities suggest that Labor most likely will only win 71 seats (after giving Labor and the Coalition one each from the "any other candidate" grouping, which remains overstated even after treating the odds to partially correct for the favourite-longshot bias problem).

Today a YouGov poll was released. It had Labor on 52.5 per cent of the two party preferred vote share: a better result for Labor than the 2022 election. This poll is up 1.5 percentage points on the previous YouGov poll from two weeks ago. Of the 10 polls released since the election was called, Labor has been the winner in eight, one was a tie and one had the Coalition ahead.

I want to talk about "Others", but first a quick look at the betting market, which now has the probability of a Labor win at 76 per cent. The odds are \$4.00 (for the Coalition) and \$1.26 (Labor).

Today, let's look the complete set of charts from the individual seats market. Overall, we can see another net seat with Labor in the lead. The two seats that were tied yesterday (McEwan and Robertson) have bounced to a Labor lead.

Yesterday a Roy Morgan poll was released that had Labor on 53.5 per cent of the two-party preferred vote. Morgan may have changed its polling approach in February 2025. Historically, their polls have been around the trend of the other polling firms. Now they appear to be consistently above the trend output from other pollsters. Out of an abundance of caution, I have set the post 15 February 2025 polls from Roy Morgan as a new series. Of note, while the earlier Morgan series tracks pretty close to the aggregation, the later Morgan polls track 2.2 percentage points more favourable to Labor on average than the aggregation. Overall, this change moves the aggregation around 0.3 percentage points less favourable to Labor.

Yesterday brought us a new Newspoll: 52 to 48 in Labor's favour in two party preferred terms. If repeated at an election, this would deliver a similar result to the 2022 election. Adding the latest Newspoll to my Gaussian Random Walk (GRW) Bayesian model to aggregate polls, it looks like Labor leads with around 51 to 49 per cent of the two party preferred vote. If replicated at an election, this is most likely to result in a minority Labor government.

Twenty-seven days until the election on 3 May. The punters are firming on Labor winning this election.

As we wake up this morning, China has retaliated to the Trump tariffs, the S&P500 is down 17.5 per cent on its February peak (down six per cent overnight) and the Australian dollar is trading at 60 cents. The Trump gloss is starting to peel off and in the process it is hurting the Coalition.
Labor continues to push ahead in the betting market. The odds at 7am this morning (my daily collection time) were Labor on \$1.53 and the Coalition on \$2.50. As I write now at 8.30am, it is \$1.50 and \$2.62. The odds have flipped from where they were just three weeks ago. The chart is from 7am this morning.

What fun we have when the betting market provider introduces multiple independents into seats. I needed a quick recode to capture this situation. The affected seats were Monash in Victoria (Deb Leonard and Russell Broadbent) and Calare in NSW (Andrew Gee and Kate Hook).
More importantly, there was some movement on both the overall winner charts and the individual seat charts. Both movements were in Labor's favour.

Let's look at the steps between the election having been called and the election being all wrapped up.
| Date | Event |
|---|---|
| Parliament prorogued | 8.29am 28 March 2025 |
| House of Representatives dissolved | 8.30am 28 March 2025 |
| Issue of writs for the election | 31 March 2025 |
| Close of electoral rolls | 8pm 7 April 2025 |
| Close of nominations | 12 noon 10 April 2025 |
| Declaration of nominations | 11 April 2025 |
| Start of early voting | 22 April 2025 |
| Close of postal voting applications | 6pm 30 April 2025 |
| Election day | 8am to 6pm 3 May 2025 |
| The return of writs | No later than 9 July 2025 |
| The new Parliament will first sit | Within 30 days of the return of writs |
The betting market has Labor slightly ahead to form government, with odds of \$1.72 for Labor to the Coalition's \$2.10. And I should note that I have updated my daily collection time for these odds from lunch time to breakfast.


Today I am looking at the individual seat betting markets. These markets are tricky to analyse because of the favourite-longshot bias problem. To reduce the impact of this problem, I multiply the odds from each seat by its square root. This has the effect of increasing the odds for longshot outcomes, and thus reducing their probability. To calculate probabilities I take the reciprocal of the odds and then adjust for the bookmaker's overround.
From the individual betting markets we can deduce which parties might win the election. For example, we can count the party that is ahead in each seat. This suggests that the punters think the most likely outcome is one in which no party secures 76 of the 150 seats to form government in their own right.

Around lunchtime every day I take a snapshot of the odds for the winner of the next Federal Election at sportsbet. I use it as a barometer of public intuition for who might win the next election. At the moment it is very close. Today the win probabilities are effectively 50/50 for both Labor and the Coalition (ignoring the long shot outcome of any other party).

Today I spent some time looking at the published two-party preferred (2pp) opinion poll estimates for each of the Australian states and territories. [Note: I have excluded Tasmania, the Northern Territory and the Australian Capital Territory because there was not enough polls for these jurisdictions].
We will start with the headline chart that shows the current state of polling compared with the outcome of the previous election. As you can see, with the exception of Queensland, Labor state polling is below what each State achieved at the 2022 Federal Election. In the three largest states, it is below 50 per cent.


An Australian Federal election is likely to called in the next few weeks, and could be called as early as this weekend. Yesterday, the betting market has saw Labor pull ahead as the favourite to form government after the election.

Since Donald Trump was sworn in as the President of the United States of America, the Australian polls have been trending away from the Coalition. Now Labor is is ahead on all of my aggregation models of the two-party preferred vote. If an election was held now, the sizeable "third party" vote would see either Labor or the Coalition form minority government.

With apologies to Banjo Patterson for the headline, we are seeing a significant change in the polls. Since the start of 2025 we have seen a significant drift in primary voting intention away from the mainstream parties (Labor and the Coalition) to the Greens and Others. One consequence of this drift has been a weakening in the Coalition's lead in the two-party preferred polls, especially if we allocate preference flows based on the flows at the previous 2022 election. We are also seeing Albanese firming in the attitudinal polls.
Let's start with the first preference, primary vote polls. Both Labor and the Coalition have declined since the start of 2025.

The localised regression has Labor on 49 per cent, and the Coalition on 51 per cent of the two party preferred vote (2pp/TPP). There is not much change since the start of 2025.


