Showing posts with label 2022 Federal Election. Show all posts

Saturday, June 25, 2022

Poll performance - 2022 Australian Federal Election

Now that the count is complete we can look at the performance of the final polls immediately prior to the 2022 Australian Federal Election. In terms of the final two party preferred (TPP) outcome, in which Labor won 52.13 per cent of that vote, all of the final polls performed well. The final estimates of TPP voting intention were all well within the margin of error. This is a substantial improvement on performance in 2019.

However, there was some patchiness among the these final polls when it came to estimating the first preference primary votes for each of the major parties. Only the final poll from Resolve Strategic had each primary vote estimate within the 2-sigma margin of error when compared with the election result. The other polls had a tendency to over-estimate Labor's primary vote share and/or under estimate the vote for one or more of the minor parties and independents.


We can sum the absolute values of the differences between the final poll estimate for each party from each pollster and the election outcome, to rank the performance of these final polls in terms of providing an estimate of the election outcome. 


Cautionary Note: This poll ranking should not be seen as a ranking of the pollsters. We expect polls to be randomly distributed around a mean. If we assume ceteris paribus, then then it is just luck (or randomness) as to whether the final poll from one pollster would be closer to the election result or not (when compared with another pollster).

Also note: where pollsters have provided an effective sample size (ESS), this was used to calculate the margin of error. Otherwise the reported sample size was used. 

Link: the Jupyter Notebook for these charts can be found here.

Monday, May 23, 2022

An early look at swings

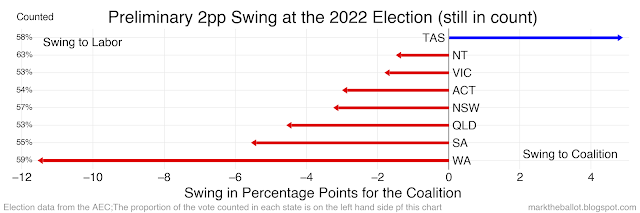
With the count now approach 75% complete, any look at swings is subject to further change, nonetheless I thought it worthwhile to get a sense of what happened where.

In terms of the two-party preferred (2pp) vote, labor gained in all states except Tasmania. But note this is an early and incomplete count. The 2pp count is not as progressed as the first preference counts, nor the two-candidate preferred (2cp) counts. And the 2pp counts have not commenced in something like 26 seats. For each state they are only 50 to 60 per cent complete, with the count completion provided on the left hand side of this chart.

With the first preference votes for the Greens, the Greens improved their overall performance in every state.

The Coalition experienced a first-preference swing against it in every state.

Labor had a mixed performance, with three states increasing Labor's first preference share, and 5 states reducing it.

The United Australia Party managed positive swings in five states and negative swings in three states.

One nation had a positive swing in six states and a negative swing in two.

Everyone else (which includes the independents) had a positive swing in six states and a negative swing in two.

Friday, May 20, 2022

2022 Final Polls and Forecast

Newspoll has just landed with a published two-party preferred (2pp) estimate of 53 to 47 per cent for Labor. This completes the polls for the 2022 Australian Federal Election. Rather than use published 2pp estimates, I calculate my own 2pp estimate for each pollster using the pollster's primary vote estimates and the preference flows from the previous election. May calculations for the latest polls are as follows.

This represents a small narrowing for Newspoll over the previous poll in the series. More generally we can see that the polls have tightened over the past 3 months.


The average 2pp estimate for the Coalition over the six polls highlighted above is 47.1 per cent. If this was repeated at the election tomorrow, almost certainly it would be a large win for an incoming Labor government. However, our experience with the 2019 election, and the substantial polling failure at that election urges caution. 

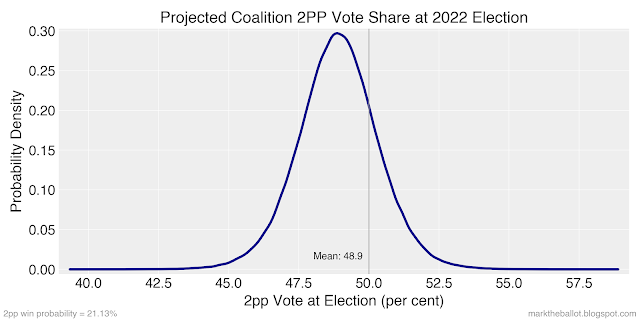
When I look at all elections since 1983, I note that the polls have been more likely to be incorrect when they have Labor in front. Adjusting for the historic weakness in the polls, I expect Labor to attract something like 51.1 per cent of the 2pp vote at tomorrow's election. In terms of a highest density interval (analogous to a Bayesian confidence interval), I have labor with a 94 per cent probability that its 2pp election result will be between 48.3 per cent and 53.8 per cent. I expect the Coalition will achieve something like 48.9 per cent of the 2pp vote share. I have the Coalition's 94 per cent HDI in the range from 46.2 to 51.7 per cent. 


The observation about the polls comes from a regression. I have now cross checked this regression as calculated in the Bayesian model (using Student's t distribution) with a simpler Gaussian regression from classical statistics over the same domain. The results are very close.

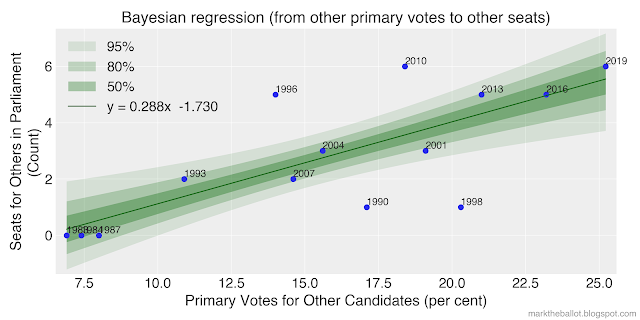
The other really interesting question this election is how many independents and minor party representatives will be elected. The polling estimate for primary votes for non-Liberal/Labor candidates is 29.1 per cent, up from 25.2 per cent in 2019. Translating the possible increase in primary votes to seats for independents is something that I have found difficult to model, and I suspect my most likely projection of 7 seats (an increase of 1) is an under estimate.


Agsin this is based on a regression, which I have now cross checked between the Bayesian model and a regression from classical statistics.
Then I have estimated how many seats both major parties would win if there were no minor parties. I have then adjusted for the minor parties.


For completeness, here are the regressions that underpin this calculation.


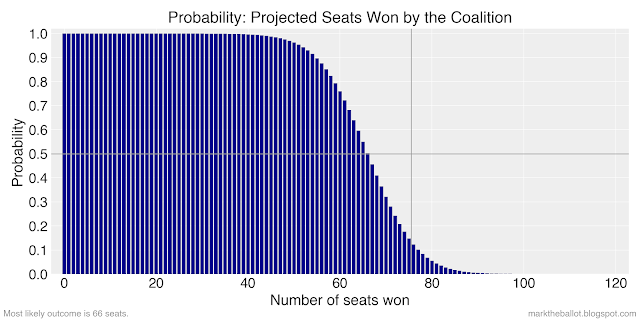
My mean prediction is a Parliament with around 77 Labor seats, 66 Coalition seats and 7 Independents and minor parties. The astute will note that this sums to 150 when there 151 seats in Parliament, welcome to the joys of rounding.

In terms of the Parliamentary outcome, the model sees a 60.4 per cent probability of a Labor majority government, a 24.7 per cent probability of a hung parliament (where the eventual winner would need to be negotiated with the cross-bench), and a 14.8 per cent probability of a majority Coalition government.


Please compare this model with what others have done. Have a look at: Buckley's and None, Australian Election Forecasts, and Armarium Interreta.


The usual caveats 

The estimate of cross-bench seats in Parliament is the weakest element of this model. My intuition is that there are special factors at play this election that are likely to see more independents take seats, primarily from the Coalition. 
 
If you want to see how the sausage was made, the Jupyter Notebook is on GitHub.

Finally, there are no guarantees with this model. It has been hastily put together in the last week of an election campaign. It has not been back-tested. It is a macro-level model in nature. So, do not blame me if you place bets based on this model and you lose your money, that's your problem.

Thursday, May 19, 2022

Modelling the 2022 Election - Closer than we first thought?

Recently in a conversation with Ethan from Armarium Interreta, he made the observation that the polls in the final week of a campaign were (on average) more accurate than the polls in the final two weeks of the campaign. This is critical because we are seeing a tightening in the most recent polls. [Note: things might not stay this way as more polls come in, but this is how it looks now].

Wednesday, May 18, 2022

Modelling the 2022 election - Part II

Most of my refinements since yesterday's post have been to correct minor glitches in the code, and data transformations to make it work better with the Hamiltonian Monte Carlo method that is used in the PyMC software. But in broad terms the model is conceptually unchanged.

Saturday, April 30, 2022

Are the polls biased?

When you look at the two-party preferred (2pp) election outcome compared with the cloud of 2pp polls immediately prior to an election, it looks like the election result, more often than not, is more favorable to the Coalition than the preceding polls. To put it another way, it looks like the polls on average favour Labor. In the following chart, the election result (in the red/orange box), is typically above most of the polls (blue dots) in the five weeks immediately prior to an election.

If we look specifically at the average of all the 2pp polls in the 14 Federal elections from 1983 (the modern polling era), the Coalition outperformed the final two-week poll average 12 times. Labor outperformed this poll average twice. The following table has the difference between the average 2pp poll for the two weeks prior to the election, and the final 2pp Election result. A negative number indicates the final fortnight polls were on average more favourable to Labor than the election result. A positive number indicates that the polls were more favourable to the Coalition than the election result.

Election Year
Ave Poll Error (for polls concluded in the final 2 weeks before the election)
1983-1.300000
1984-3.400000
1987-2.316667
1990-1.466667
19931.618182
1996-1.941667
1998-0.087500
20010.100000
2004-0.877778
2007-1.500000
2010-2.192308
2013-0.455556
2016-0.327273
2019-3.270000

We can visualise this tendency to favour Labor in the polls as a probability density function, where the area under the curve sums to one. The statistical technique to construct this curve is known as a Kernel Density Estimate (KDE). It is clear, that on average, these polls collectively were a little over one percentage point favourable to Labor when compared with the final Election result.

The next long series of charts shows each of the elections and the way in which the rows in the above table were constructed. Feel free to skip past these charts if this is not your thing.


I have been thinking about whether I can model this bias, and whether I should model it. Using Bayesian techniques, I have found a Student's t-distribution that provides a good algebraic approximation of the probability density function above. So it can be modeled easily. For the nerdy, this distribution has a location of -1.255 percentage points (this is the historic pro-Labor bias), a scale factor of 1.44 percentage points, and 11.22 degrees of freedom.

I am more conflicted on whether I should model the pro-Labor bias. I have not found a compelling theory of action for how the historic bias arose. I assume that the pollsters would rather get the final election result correct (as this reflects well on their business), than to favour one side of politics or the other. It has also been reported to me that this bias does not exist in state government polling. I think this historical bias is unlikely to have occurred by chance alone. Nonetheless, if I don't know why it has occurred in the past, I cannot be confident that the driving factors will persist into the future.

I will think about this some more. If you have any compelling explanations for the historical bias, let me know in the comments below.

Finally, I want to thank Ethan and Rebecca at armariuminterreta.com who compiled this data. Ethan tells me that he in turn was assisted by William Bowe and Kevin Bonham.