There are two posts this morning. This is the polls post, and separately there is a betting market update.
Two-party preferred
There is an abundance of new polls today, each with the following two-party preferred (2pp) population estimate:
- YouGov - 52.2 per cent to Labor
- Newspoll - 52.5 per cent to Labor
- Freshwater Strategy - 51.5 per cent to Labor, and
- Roy Morgan - 53 per cent to Labor.
Which results in my national aggregation of 52.1 per cent for Labor, which means that if the polls in aggregate are reasonably correct I expect the final result to be somewhere in the range 51 to 53 per cent for Labor, which would see either a Labor minority or majority government. My central estimate is that the new Parliament will be much like the previous Parliament.


The polls since 1 April have been too tightly clustered in the 52 to 53 per cent range, for what you would expect mathematically from random sampling. In the next chart we have a kernel density estimate for all of the polls since 1 April (the thicker blue line), and how I would expect the polls to be distributed around the same mean (the thin red line).

I can also test this, and observe that it is statistically unusual.

I do not know why the polls are under-dispersed. One possibility is herding. Another is an unknown artefact in the way the polling data has been produced (such as resampling, or panel partitioning based on previous polls).
Because there is a bias-variance trade-off in data, I think we should be alert to an elevated possibility of a polling failure, while recognising there is no certainty here, and the polls could end up being reasonably accurate. I should note that the degree of under-dispersion in the 2025 polls collectively is nowhere as bad as it was with the polls prior to the election in 2019. As it turned out, those 2019 polls were off the mark by around 3 percentage points.
Primary votes
The following charts are my aggregations of first-preference primary votes. Please note that One Nation (ONP) is both reported separately and included in the Others chart.


I should also note that the One Nation polls are over-dispersed. I suspect this reflects the difficulty pollsters face in eliciting reliable responses for micro-parties.
Pulling it together, we can see that the minor party and independents vote is likely to exceed the previous election.


Attitudinal polling
The attitudinal polling shows some interesting movements in recent months. Please note, these charts are localised regressions.


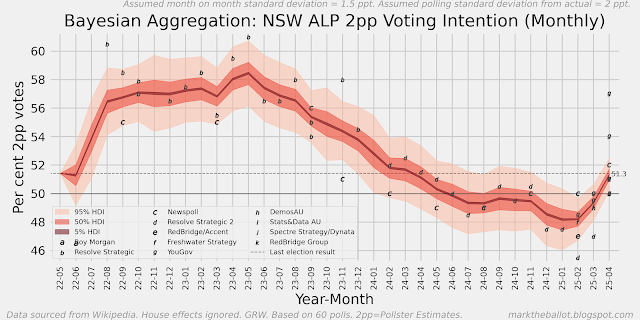
State differences
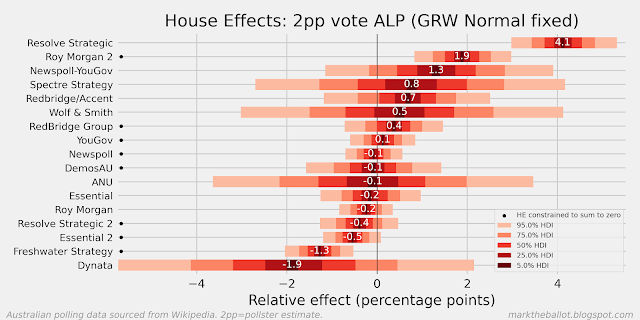
These are the most speculative polling charts I produce, and they are really only useful for the three largest states. Also, given that the data is either too thin or missing in respect of Tasmania, the Northern Territory and the Australian Capital Territory, I cannot normalise these polls back to the national polls. Finally, I do not adjust for house effects with these charts. In sum, I treat them as impressionistic. I focus more on the trend over recent months, rather than the level compared with the past election.


Amazed at the quantity and quality of work that you have produced here. Much obliged.
ReplyDeleteThank you
Delete