On the popular count, Hillary got 2.86 million more votes than Donald. Nonetheless, Trump won 306 electoral college votes to Clinton's 232.
2012
Dem                   65918507
Rep                   60934407
Other                  2384728
Total                129237642

2016
Dem_2016              65818318
Rep_2016              62958211
Other_2016             8130756
Total_2016           136907285

                          Swing
State
Alabama                5.538357
Alaska                 0.741723
Arizona               -5.532347
Arkansas               3.233032
California            -6.904200
Colorado               0.454730
Connecticut            3.692955
Delaware               7.196230
District of Columbia  -3.141525
Florida                2.063364
Georgia               -2.694949
Hawaii                10.523484
Idaho                  0.070853
Illinois              -0.115693
Indiana                8.967002
Iowa                  15.216986
Kansas                -0.986894
Kentucky               7.156187
Louisiana              2.432006
Maine                 12.327412
Maryland              -0.345453
Massachusetts         -4.047876
Michigan               9.691593
Minnesota              6.173972
Mississippi            6.304284
Missouri               9.278486
Montana                6.781621
Nebraska               3.272717
Nevada                 4.263805
New Hampshire          5.208235
New Jersey             3.759336
New Mexico             1.936178
New York               5.608862
North Carolina         1.613141
North Dakota          16.097549
Ohio                  11.044685
Oklahoma               2.846545
Oregon                 1.111639
Pennsylvania           6.102260
Rhode Island          11.948748
South Carolina         3.792815
South Dakota          11.772774
Tennessee              5.622094
Texas                 -6.772736
Utah                 -29.960350
Vermont                9.189564
Virginia              -1.450352
Washington            -0.959397
West Virginia         14.985933
Wisconsin              7.706614
Wyoming                5.471542


Change in raw vote count (percent change on 2012 vote count)

                            Turnout Republican   Democrat        Other
State
Alabama                    2.363838   4.962876  -8.313351   232.658362
Alaska                     6.027721  -0.782749  -5.044031   194.157372
Arizona                   12.892191   1.519632  13.258950   299.297296
Arkansas                   5.719386   5.731894  -3.528064   138.949295
California                 9.046888  -7.358494  11.452386   176.393637
Colorado                   8.102118   1.454638   1.191745   276.161005
Connecticut                5.511699   6.034976  -0.832717   290.481959
Delaware                   6.684609  11.870030  -2.877766   256.398428
District of Columbia       5.958525 -40.493896   5.901075   195.783926
Florida                   11.886731  10.914970   6.305672   316.343490
Georgia                    5.817874   0.501085   5.870697   202.012389
Hawaii                    -1.325061   6.471925 -12.967866   372.650911
Idaho                      5.130021  -2.816747 -10.819270   297.556848
Illinois                   6.103345   0.505757   2.358560   246.625786
Indiana                    3.853494   9.446668 -10.495679   157.516608
Iowa                      -1.020680   9.631038 -20.530817   283.814053
Kansas                     2.321232  -2.724087  -2.933113   210.544670
Kentucky                   7.013217  10.649564  -7.435712   193.203760
Louisiana                  1.753554   2.289063  -3.582441   115.051130
Maine                      4.871982  14.820581 -10.857301   178.589652
Maryland                   2.716443  -2.953073   0.005006   177.316277
Massachusetts              4.964980  -8.209532   3.821235   315.245195
Michigan                   1.136468   7.766767 -11.531372   283.049579
Minnesota                  0.281009   0.206480 -11.541509   262.191281
Mississippi               -5.794721  -1.411475 -13.823277   112.322315
Missouri                   1.625110   7.559901 -12.479858   148.939133
Montana                    2.613709   4.222030 -11.955073   173.139906
Nebraska                   6.275090   4.398776  -5.821948   270.035975
Nevada                    10.884328  10.460408   1.484268   270.742817
New Hampshire              4.670929   4.810892  -5.691888   333.872792
New Jersey                 7.000088   8.330285   1.018899   241.871082
New Mexico                 1.857846  -4.801244  -7.247403   186.259729
New York                   8.123803  12.142481   0.781297   226.157489
North Carolina             5.242209   4.062553   0.501517   235.075814
North Dakota               6.736262  15.216063 -24.889647   250.814569
Ohio                      -0.972467   6.747032 -15.332023   196.100719
Oklahoma                   8.848788   6.485962  -5.224249          inf
Oregon                    11.852096   3.742898   3.257949   235.609145
Pennsylvania               7.078056  10.831679  -2.134119   213.004051
Rhode Island               4.056729  14.846314  -9.708342   238.961606
South Carolina             7.072335   7.814528  -1.220406   247.749887
South Dakota               1.712959   8.114999 -19.027296   204.971834
Tennessee                  1.914865   4.143730  -9.369539   202.144461
Texas                     12.120132   2.520962  17.222571   233.890213
Utah                      11.819337 -30.430597  23.375680  1009.438273
Vermont                    5.271476   2.881400 -10.372467   459.295526
Virginia                   3.327627  -2.912393   0.489548   285.448983
Washington                 5.266186  -5.340095  -0.722230   247.540344
West Virginia              7.307039  17.171110 -20.764346   165.921581
Wisconsin                 -3.007528  -0.190488 -14.710130   376.990097
Wyoming                    2.725437   2.022087 -19.214560   188.857370
2016 Vote share by state (per cent)

                        Democrat  Republican         Other
State
Alabama                34.357946   62.083092      3.558962
Alaska                 36.550871   51.281512     12.167617
Arizona                44.592951   48.096662      7.310387
Arkansas               33.653124   60.574102      5.772774
California             61.486357   31.494153      7.019490
Colorado               48.156980   43.251397      8.591622
Connecticut            54.566301   40.926914      4.506785
Delaware               53.353337   41.922824      4.723839
District of Columbia   90.863822    4.087474      5.048704
Florida                47.412719   48.601054      3.986227
Georgia                45.408007   50.513268      4.078725
Hawaii                 62.221492   30.038677      7.739831
Idaho                  27.484926   59.246154     13.268920
Illinois               55.469481   38.514648      6.015871
Indiana                37.779633   56.947259      5.273108
Iowa                   41.740489   51.147327      7.112184
Kansas                 36.052401   56.654630      7.292969
Kentucky               32.682188   62.519639      4.798173
Louisiana              38.449566   58.088685      3.461749
Maine                  47.830267   44.869813      7.299920
Maryland               60.338239   33.916328      5.745432
Massachusetts          60.005065   32.808358      7.186577
Michigan               47.274915   47.497950      5.227135
Minnesota              46.444919   44.924788      8.630293
Mississippi            40.057452   57.858223      2.084324
Missouri               38.135272   56.772408      5.092320
Montana                35.745765   56.168497      8.085737
Nebraska               33.698756   58.747351      7.553892
Nevada                 47.917824   45.500695      6.581481
New Hampshire          46.833499   46.465846      6.700655
New Jersey             54.989258   41.004520      4.006222
New Mexico             48.255708   40.042439     11.701853
New York               59.044374   36.476002      4.479624
North Carolina         46.172973   49.828210      3.998816
North Dakota           27.226739   62.955628      9.817633
Ohio                   43.242777   51.313504      5.443719
Oklahoma               28.931680   65.322865      5.745455
Oregon                 50.071852   39.094035     10.834113
Pennsylvania           47.484263   48.203263      4.312473
Rhode Island           54.406607   38.898057      6.695336
South Carolina         40.673420   54.939333      4.387248
South Dakota           31.737050   61.532994      6.729956
Tennessee              34.716333   60.722034      4.561634
Texas                  43.235258   52.234686      4.530056
Utah                   27.215993   45.135521     27.648486
Vermont                56.677786   30.269435     13.052779
Virginia               49.751353   44.427647      5.821000
Washington             52.624176   36.892618     10.483206
West Virginia          26.176634   67.852186      5.971180
Wisconsin              46.453841   47.218185      6.327974
Wyoming                21.877357   68.172633      9.950010
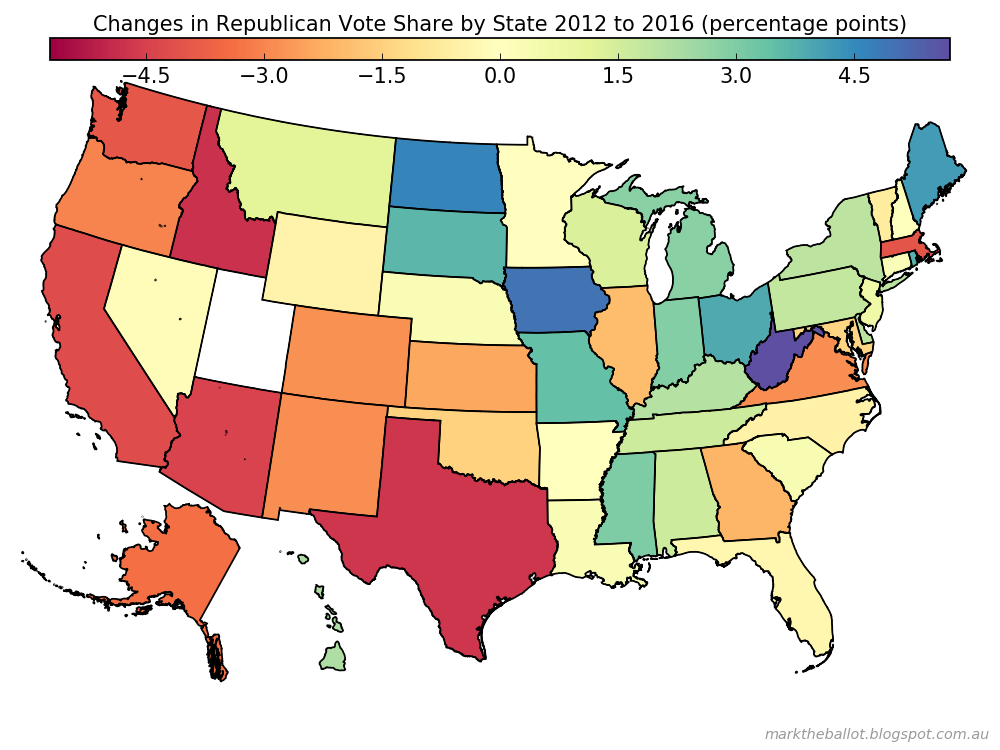
Percentage point change in party vote share by state from 2012 to 2016

                         Democrats   Republicans          Others
State
Alabama                  -4.001087      1.537270        2.463817
Alaska                   -4.261788     -3.520065        7.781853
Arizona                   0.144402     -5.387945        5.243542
Arkansas                 -3.225866      0.007166        3.218700
California                1.327071     -5.577129        4.250057
Colorado                 -3.288635     -2.833905        6.122540
Connecticut              -3.490983      0.201972        3.289011
Delaware                 -5.253016      1.943215        3.309801
District of Columbia     -0.049292     -3.190817        3.240109
Florida                  -2.489173     -0.425809        2.914982
Georgia                   0.022655     -2.672293        2.649638
Hawaii                   -8.323739      2.199746        6.123993
Idaho                    -4.915469     -4.844615        9.760084
Illinois                 -2.029349     -2.145043        4.174392
Indiana                  -6.056763      2.910239        3.146524
Iowa                    -10.247527      4.969459        5.278069
Kansas                   -1.951559     -2.938453        4.890012
Kentucky                 -5.101564      2.054623        3.046941
Louisiana                -2.127898      0.304109        1.823789
Maine                    -8.439679      3.887733        4.551946
Maryland                 -1.635951     -1.981404        3.617355
Massachusetts            -0.661045     -4.708921        5.369966
Michigan                 -6.769304      2.922289        3.847016
Minnesota                -6.207385     -0.033413        6.240798
Mississippi              -3.731907      2.572377        1.159530
Missouri                 -6.145977      3.132509        3.013468
Montana                  -5.914847      0.866774        5.048072
Nebraska                 -4.328558     -1.055841        5.384399
Nevada                   -4.438426     -0.174620        4.613046
New Hampshire            -5.146185      0.062050        5.084135
New Jersey               -3.255838      0.503498        2.752340
New Mexico               -4.737121     -2.800942        7.538063
New York                 -4.301727      1.307135        2.994593
North Carolina           -2.177995     -0.564854        2.742849
North Dakota            -11.464071      4.633479        6.830592
Ohio                     -7.333907      3.710778        3.623129
Oklahoma                 -4.296000     -1.449455        5.745455
Oregon                   -4.167475     -3.055836        7.223311
Pennsylvania             -4.469722      1.632537        2.837185
Rhode Island             -8.294352      3.654396        4.639956
South Carolina           -3.414614      0.378201        3.036412
South Dakota             -8.129091      3.643683        4.485409
Tennessee                -4.322533      1.299561        3.022971
Texas                     1.881935     -4.890801        3.008866
Utah                      2.549265    -27.411084       24.861819
Vermont                  -9.892764     -0.703200       10.595965
Virginia                 -1.405104     -2.855456        4.260560
Washington               -3.174280     -4.133677        7.307957
West Virginia            -9.273785      5.712148        3.561636
Wisconsin                -6.373920      1.332694        5.041226
Wyoming                  -5.941530     -0.469989        6.411519
Republican results


Democrat results


Other parties results