Saturday, May 28, 2022

Update on the count

One week after the election, and we are still not absolutely clear on whether Labor can form majority government (though it does seem likely). My conservative attribution of seats is as follows. 

 
My allocated seats are as follows.

  • Labor: 74 - (Adelaide, Ballarat, Barton, Bean, Bendigo, Bennelong, Blair, Blaxland, Boothby, Brand, Bruce, Burt, Calwell, Canberra, Chifley, Chisholm, Cooper, Corangamite, Corio, Cowan, Cunningham, Dobell, Dunkley, Eden-Monaro, Fenner, Franklin, Fraser, Fremantle, Gellibrand, Gorton, Grayndler, Greenway, Hasluck, Hawke, Higgins, Hindmarsh, Holt, Hotham, Hunter, Isaacs, Jagajaga, Kingsford Smith, Kingston, Lalor, Lilley, Lyons, Macarthur, Macquarie, Makin, Maribyrnong, McEwen, McMahon, Moreton, Newcastle, Oxley, Parramatta, Paterson, Pearce, Perth, Rankin, Reid, Richmond, Robertson, Scullin, Shortland, Solomon, Spence, Swan, Sydney, Tangney, Watson, Werriwa, Whitlam, Wills)
  • Coalition: 58 - (Aston, Banks, Barker, Bass, Berowra, Bonner, Bowman, Braddon, Bradfield, Calare, Canning, Capricornia, Casey, Cook, Cowper, Dawson, Deakin, Dickson, Durack, Fadden, Fairfax, Farrer, Fisher, Flinders, Flynn, Forde, Forrest, Gippsland, Grey, Groom, Herbert, Hinkler, Hughes, Hume, La Trobe, Leichhardt, Lindsay, Longman, Lyne, Mallee, Maranoa, McPherson, Menzies, Mitchell, Monash, Moncrieff, Moore, New England, Nicholls, O'Connor, Page, Parkes, Petrie, Riverina, Sturt, Wannon, Wide Bay, Wright)
  • Independent: 10 - (Clark, Curtin, Fowler, Goldstein, Indi, Kooyong, Mackellar, North Sydney, Warringah, Wentworth) 
  • Green: 3 - (Griffith, Melbourne, Ryan)
  • Other: 2 - (Kennedy, Mayo)

And my unallocated seats are: Brisbane, Gilmore, Lingiari, and Macnamara. These seats have the following first preferences.

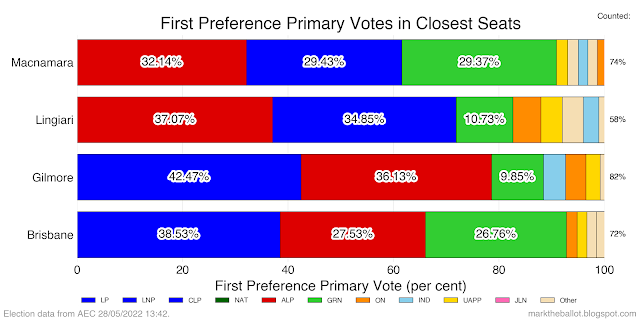
Brisbane and Macnamara will be won by either the Greens or Labor, based on preference flows. Which ever party comes third in the preferential count will determine this outcome. The AEC is about half-way through its three candidate counts in Brisbane and Macnamara. At this point in the count, Labor is in first position, and it is likely to win Macnamara. The Greens are just ahead of Labor for second position in Brisbane, and likely to win on Labor preferences. 

The next chart is based on the two-candidate preferred (TCP) counts from the AEC. The counts for Brisbane and Macnamara may have the wrong candidates. This will be determined by the three-candidate counts currently underway.

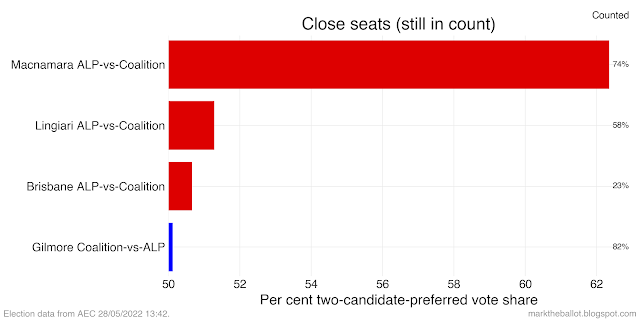
My system has not allocated Lingiari, because the TCP vote count is low. However, this seat is highly likely to go to Labor. 

Gilmore will continue to be counted for the rest of next week, until postal votes close.  For sake of the next chart, let's assume the Coalition remains ahead.

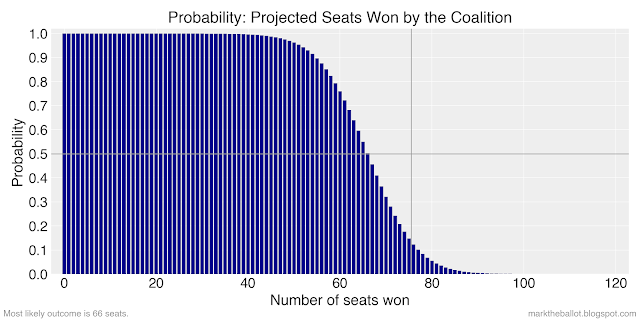
Based on the current state of the count, the most likely outcome looks like:


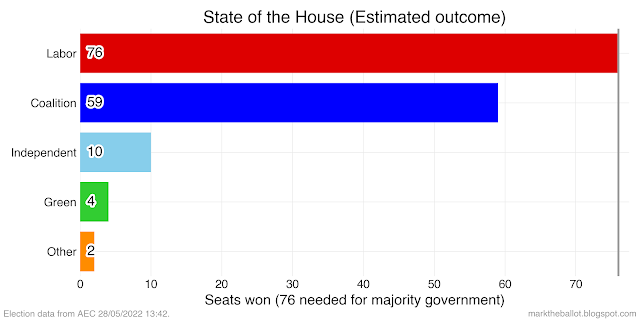
But if Gilmore flips, it will be Labor on 77 and the Coalition on 58.

Tuesday, May 24, 2022

State of the House (10am Tuesday)

Using the latest data from the Australian Electoral Commission, this is my take on the official count.

Let's start by allocating those seats where the two-candidate preferred vote (2cp) is higher than 51.5 per cent, and where the official 2cp count is greater than 50 per cent of enrolments in the division.

This allocates 71 seats to Labor: Adelaide, Ballarat, Barton, Bean, Bendigo, Blair, Blaxland, Boothby, Brand, Bruce, Burt, Calwell, Chifley, Chisholm, Cooper, Corangamite, Corio, Cowan, Cunningham, Dobell, Dunkley, Eden-Monaro, Fenner, Franklin, Fraser, Fremantle, Gorton, Grayndler, Greenway, Hasluck, Hawke, Higgins, Hindmarsh, Holt, Hotham, Hunter, Isaacs, Jagajaga, Kingsford Smith, Kingston, Lalor, Lilley, Macarthur, Macnamara, Macquarie, Makin, Maribyrnong, McEwen, McMahon, Moreton, Newcastle, Oxley, Parramatta, Paterson, Pearce, Perth, Rankin, Reid, Richmond, Robertson, Scullin, Shortland, Solomon, Spence, Swan, Sydney, Tangney, Watson, Werriwa, Whitlam, and Wills.

It allocates 46 seats to the Coalition: Aston, Banks, Barker, Berowra, Bonner, Bowman, Braddon, Canning, Capricornia, Cook, Cowper, Dawson, Dickson, Durack, Fadden, Fairfax, Farrer, Fisher, Flinders, Flynn, Forde, Forrest, Gippsland, Groom, Herbert, Hughes, Hume, La Trobe, Leichhardt, Lindsay, Longman, Lyne, Mallee, McPherson, Mitchell, Monash, Moncrieff, New England, Nicholls, O'Connor, Page, Parkes, Petrie, Riverina, Wide Bay, and Wright.

And it allocates 12 seats to the cross-bench: Clark, Curtin, Fowler, Goldstein, Indi, Kennedy, Kooyong, Mackellar, Mayo, North Sydney, Warringah, and Wentworth.

It leaves us with 22 seats where either the count is close or the official 2cp counts is not well progressed. [In the case of Brisbane and Wannon, the official 2cp count has not (re-)started].

Some of these we can clear up quickly. Based on first preference votes, and likely preference allocations, we can add the following seats to the Coalition, bringing the Coalition to 56

  • Wannon will be retained by the Coalition.
  • Maranoa is on the list above because of a TCP realignment. It will go to the Coalition.
  • Wannon is on the list above because of a TCP realignment. It will go to the Coalition.
  • Bradfield, similarly, will be retained by the Coalition.
  • Calare will be retained by the Coalition.
  • Hinkler will be retained by the Coalition 
  • Grey should be held by the Coalition 
  • Casey should be retained by the Coalition
  • Moore should be retained by the Coalition 
  • Menzies should be retained by the Coalition

We can add the following seats to Labor, bringing the Labor total to 75

  • Canberra will be retained by Labor
  • Gelibrand will be retained by Labor
  • Lingiari will be retained by Labor
  • Benelong should be won by Labor

 And we can these seats to the cross-bench, bringing its total to 14.

  • No-one doubts that Melbourne will be won by the Greens
  • The Greens are well placed to win Griffith
From here the landscape is a little less clear. The Coalition may pick up these two seats bringing them to 58 seats.
  • Bass is a possible Coalition win, but if not this will go to Labor.
  • Sturt is a possible Coalition win, but otherwise it will go to Labor

Labor are in the running to win one more seat, bringing their total to 76 seats.

  •  Labor is ahead in Lyons, but if not this will go to the Coalition.

The Greens are in the running to pick one more seat, bringing the cross-bench to 15 seats.

  • The Greens look ahead in Brisbane, if not Labor will win this seat.

Unknown

  • Gilmore is just too close to speculate (but it is between the Coalition and Labor)
  • Deakin is just too close to speculate (but it is between the Coalition and Labor)

In summary, the likely outcome is:

  • Labor is likely to win 76 seats (could get as high as 78 or 79)
  • The Coalition are likely to get 58 seats (could get as high as 60 seats).
  • The cross-bench is likely to win 15 seats.

Monday, May 23, 2022

An early look at swings

With the count now approach 75% complete, any look at swings is subject to further change, nonetheless I thought it worthwhile to get a sense of what happened where.

In terms of the two-party preferred (2pp) vote, labor gained in all states except Tasmania. But note this is an early and incomplete count. The 2pp count is not as progressed as the first preference counts, nor the two-candidate preferred (2cp) counts. And the 2pp counts have not commenced in something like 26 seats. For each state they are only 50 to 60 per cent complete, with the count completion provided on the left hand side of this chart.

With the first preference votes for the Greens, the Greens improved their overall performance in every state.

The Coalition experienced a first-preference swing against it in every state.

Labor had a mixed performance, with three states increasing Labor's first preference share, and 5 states reducing it.

The United Australia Party managed positive swings in five states and negative swings in three states.

One nation had a positive swing in six states and a negative swing in two.

Everyone else (which includes the independents) had a positive swing in six states and a negative swing in two.

Sunday, May 22, 2022

Did we have a polling fail in 2022

Although the count is only two thirds completed, we can start to look at how the final polls before the 2022 Australian Federal Election compared with the 95 per cent margin of error your would expect from random sample opinion polling. Note: I updated this post when the election count was completed.

Headline: While the two-party preferred (2pp) estimates from the pollster's final polls this election look good, all of the pollsters had some struggles when it came to the estimating the primary vote shares for the parties. Pollsters particularly had challenges with Labor's primary vote, the vote for the United Australia Party and the vote for Others.

In each of the charts below we have looked at whether to polls individually or collectively over or under-estimated the vote share seen so far in the 2022 Election. 

To provide a benchmark for assessing the polls, I have also calculated the 95 per cent confidence interval based on the reported sample size on Wikipedia.

Caveats: First, the error bars in the following charts were calculated from the headline reported sample size, not the effective sample size reported by the pollster as a consequence of stratification and weighting. Second, these results are likely to change somewhat between now and when the count has been completed.


Initial reflections on the election

Well that was a little unusual. And while it is still early in the count, we can make some observations. 

  • First, the election saw a huge repudiation of the Coalition under Scott Morrison in all states but Tasmania, but only a lukewarm embrace for Labor in all states but Western Australia. If labor gets to majority government it will be because of its superlative performance in Western Australia. 
  • Second we saw Labor struggling to convert a respectable two-party preferred vote of around 52.4 per cent into a majority of seats in the House. The Labor primary vote is very low by historical standards, currently at 32.8 per cent. I can remember a time when the conventional wisdom was that Labor could not win with a primary vote below 40 per cent. 
  • Third, the Greens and green-leaning independents did stunningly well in many city based Coalition seats. It is primarily in wealthy urban areas that the Coalition has lost many of its traditional heartland seats. This loss of their heartland could make it very hard for the Coalition to return to majority government for a number of election cycles.

In addition to retaining Warringah (NSW), Indi (Vic), and Clark (Tas), it looks like independents have picked up 7 seats, with a further 1 seat still a possibility. Likely gains include Kooyong (Vic), Flowler (NSW, a Labor loss), Curtin (WA), North Sydney (NSW), Goldstein (Vic), Wentworth (NSW), Mackellar (NSW), The seat where an independent is still a possibility is Cowper (NSW).

In addition to retaining Melbourne (Vic) the Greens look well placed in Ryan (Qld, a former Coalition seat) and Griffith (Qld, a former Labor seat). The Greens are still in the race in Richmond (NSW, Labor), Brisbane (Qld, a former Coalition seat) and possibly Macnamara (Vic).

The one-seat, minor parties in Mayo (SA, Sharkie) and Kennedy (Qld, Katter) will be returned. 

The new parliament could see the cross bench expand from 6 to at least 13 and possibly as high as 18.

Saturday, May 21, 2022

The seats to watch at your 2022 election party

I know, you are busy, and it is too hard to get your head around the intricacies of 151 electorates. But here’s the secret: Most seats in the Australian Parliament are unlikely to change hands. This is my pick of the seats you should keep an eye on. By just watching a few seats, and ticking them off as they are decided, you should be able to get a good idea who is winning early in the evening. 

The baseline

The Australian Parliament has 151 seats. For majority government a party needs to win 76 seats. In the most recent parliament, the Coalition had 77 seats. Coming into the election (with seat boundary changes) it has a notional 76 seats. Similarly, while Labor had 68 seats in the last Parliament, coming into the election it has a notional 69 seats. And there were 6 seats for the crossbench.

The headline message is that Labor must win seven additional seats to achieve majority government, without losing any of its existing seats to the Greens on its left flank, or the Coalition on the right.

The Coalition cannot afford to lose any seats if it is to retain majority government. The Coalition faces tough fights from Labor, which is well ahead in the published opinion polls. It also faces challenges from the (so called) Teal independents in several inner-city seats.

If neither the Coalition nor the Labor Party can achieve majority government, one of these parties will need to negotiate with the crossbench for their support before that party can form government. This process last happened in 2010, and it took 17 days after the election before the Government was settled.

Most pundits expect all six of the existing crossbench seats will be retained by their current occupants. Many pundits believe there is a reasonable prospect of the crossbench being increased at the 2022 election.

The seven (or more) seats Labor would be looking to win

Note: if a big swing against the Coalition occurs, many more seats would be won by Labor. This list should give you a sense on Saturday night as to whether Labor can form majority government or not.

  • Bass (Tas) – Coalition held – 0.4% -
  • Chisholm (Vic) – Coalition held – 0.5%
  • Boothby (SA) – Coalition held – 1.4%
  • Higgins (Vic) – Coalition held – 2.6% – the Greens also have a slim chance with this seat
  • Braddon (Tas) – Coalition held – 3.1%
  • Reid (NSW) – Coalition held – 3.2%
  • Swan (WA) – Coalition held – 3.2%
  • Longman (Qld) – Coalition held 3.3%
  • Leichardt (Qld) – Coalition held – 4.2%
  • Robertson (NSW) – Coalition held - 4.2%
  • Casey (Vic) – Coalition held – 4.6%
  • Dickson (Qld) – Coalition held -4.6%
  • Deakin (Vic) – Coalition held – 4.7%
  • Lindsay (NSW) – Coalition held – 5.0%
  • La Trobe (Vic) – Coalition held – 5.1%
  • Pearce (WA) – Coalition held – 5.2%

The seats Labor needs to hold on to (but also see Green possible wins below)

  • Macquarie (NSW) – Labor held – 0.2%
  • Lilley (Qld) – Labor held – 0.6%
  • Cowan (WA) – Labor held – 0.9%
  • Eden-Monaro (NSW) – Labor held – 0.9%
  • Corangamite (Vic) – Labor held – 1.1%
  • Blair (Qld) – Labor Held – 1.2%
  • Hunter (NSW) – Labor Held – 3.0% – Fitzgibbon has retired – a coal seat

Where independents have some chance of picking up another seat from the Coalition

  • Goldstein (Vic) – Coalition held – 7.8% – Tim Wilson is the incumbent and Zoe Daniels is the independent challenger
  • Kooyong (Vic) – Coalition held – 6.4% – Josh Frydenberg is the incumbent and Monique Ryan is the independent challenger
  • Wentworth (NSW) – Coalition held – 1.3% (TCP vs Ind.) – Dave Sharma is the incumbent and Allegra Spender is the challenger
  • North Sydney (NSW) – Coalition held – 9.3% - Trent Zimmerman is the incumbent and Kylie Tink is the challenger
  • Curtin (WA) – Coalition held – 13.9% – Celia Hammond is the incumbent and Kate Chaney is the challenger
  • Nicholls (Vic) – Coalition Held – 20.0%  – Because the former incumbent retired, Nichols is a rare three-way contest between Steven Brooks (Liberal), Sam Birrell (National) and Rob Priestly (independent)

Where the Greens have some chance of picking up another seat

While I think an additional Green seat is semi-unlikely, they may prove competitive in one of these seats.

  • Brisbane (Qld) – Coalition held – 4.9%
  • Ryan (Qld) – Coalition held – 6.0%
  • Griffith (Qld) – Labor held – 2.9%
  • Macnamara (Vic) – Labor held – 4.9%
  • Wills (Vic) – Labor held – 8.2% (TCP vs Green)

Links to useful sites


Friday, May 20, 2022

2022 Final Polls and Forecast

Newspoll has just landed with a published two-party preferred (2pp) estimate of 53 to 47 per cent for Labor. This completes the polls for the 2022 Australian Federal Election. Rather than use published 2pp estimates, I calculate my own 2pp estimate for each pollster using the pollster's primary vote estimates and the preference flows from the previous election. May calculations for the latest polls are as follows.

This represents a small narrowing for Newspoll over the previous poll in the series. More generally we can see that the polls have tightened over the past 3 months.


The average 2pp estimate for the Coalition over the six polls highlighted above is 47.1 per cent. If this was repeated at the election tomorrow, almost certainly it would be a large win for an incoming Labor government. However, our experience with the 2019 election, and the substantial polling failure at that election urges caution. 

When I look at all elections since 1983, I note that the polls have been more likely to be incorrect when they have Labor in front. Adjusting for the historic weakness in the polls, I expect Labor to attract something like 51.1 per cent of the 2pp vote at tomorrow's election. In terms of a highest density interval (analogous to a Bayesian confidence interval), I have labor with a 94 per cent probability that its 2pp election result will be between 48.3 per cent and 53.8 per cent. I expect the Coalition will achieve something like 48.9 per cent of the 2pp vote share. I have the Coalition's 94 per cent HDI in the range from 46.2 to 51.7 per cent. 


The observation about the polls comes from a regression. I have now cross checked this regression as calculated in the Bayesian model (using Student's t distribution) with a simpler Gaussian regression from classical statistics over the same domain. The results are very close.

The other really interesting question this election is how many independents and minor party representatives will be elected. The polling estimate for primary votes for non-Liberal/Labor candidates is 29.1 per cent, up from 25.2 per cent in 2019. Translating the possible increase in primary votes to seats for independents is something that I have found difficult to model, and I suspect my most likely projection of 7 seats (an increase of 1) is an under estimate.


Agsin this is based on a regression, which I have now cross checked between the Bayesian model and a regression from classical statistics.

Then I have estimated how many seats both major parties would win if there were no minor parties. I have then adjusted for the minor parties.


For completeness, here are the regressions that underpin this calculation.


My mean prediction is a Parliament with around 77 Labor seats, 66 Coalition seats and 7 Independents and minor parties. The astute will note that this sums to 150 when there 151 seats in Parliament, welcome to the joys of rounding.

In terms of the Parliamentary outcome, the model sees a 60.4 per cent probability of a Labor majority government, a 24.7 per cent probability of a hung parliament (where the eventual winner would need to be negotiated with the cross-bench), and a 14.8 per cent probability of a majority Coalition government.


Please compare this model with what others have done. Have a look at: Buckley's and None, Australian Election Forecasts, and Armarium Interreta.


The usual caveats 

The estimate of cross-bench seats in Parliament is the weakest element of this model. My intuition is that there are special factors at play this election that are likely to see more independents take seats, primarily from the Coalition. 
 
If you want to see how the sausage was made, the Jupyter Notebook is on GitHub.

Finally, there are no guarantees with this model. It has been hastily put together in the last week of an election campaign. It has not been back-tested. It is a macro-level model in nature. So, do not blame me if you place bets based on this model and you lose your money, that's your problem.

Poll round-up

The polls have tightened in the last week of the 2022 Australian Federal Election campaign (albeit off a set of polls in early May that were more favourable to Labor than the late April polls). 


Thursday, May 19, 2022

Modelling the 2022 Election - Closer than we first thought?

Recently in a conversation with Ethan from Armarium Interreta, he made the observation that the polls in the final week of a campaign were (on average) more accurate than the polls in the final two weeks of the campaign. This is critical because we are seeing a tightening in the most recent polls. [Note: things might not stay this way as more polls come in, but this is how it looks now].

Wednesday, May 18, 2022

Modelling the 2022 election - Part II

Most of my refinements since yesterday's post have been to correct minor glitches in the code, and data transformations to make it work better with the Hamiltonian Monte Carlo method that is used in the PyMC software. But in broad terms the model is conceptually unchanged.

Tuesday, May 17, 2022

A quick and dirty Bayesian model of the 2022 Election

UPDATE: unfortunately there were glitches in my code from yesterday. I have now corrected these and updated the charts: here. Yesterday's post (with the errors) follows.

Monday, May 9, 2022

Poll update Monday May 9

Two polls were released in the past 24 hours. Ipsos has Labor on 57 to 43 per cent of the two-party preferred (2pp) vote. A Labor win of this magnitude would be record breaking for Labor; the Coalition won 56.9 per cent of the two party vote in 1966 with a rally-to-the-flag election on Australia's participation in the Vietnam war.

Newspoll has Labor well ahead with 54 to 46 per cent of the 2pp vote.  If this was repeated at the election, Labor would have a comfortable win. 

The aggregate polls show a movement to Labor over the past week.


With the latest Ipsos poll, any concerns I might of had about the polls being in a narrow range (collectively) are no longer there. I cannot use the Chi-squared statistic to reject the null hypothesis that the polls (collectively) have the expected variance. Collectively, the polls are not under-dispersed. 


A number of people have developed probability models for the election outcome. The most likely outcome from each of these models (at 2pm on Monday 9 May) is reasonably similar:

  • Buckley's and None: Labor has a 70% probability for forming majority government. The Coalition has an 8% chance of forming majority government. There is a 22% chance of minority government.

  • Australian Election Forecasts: Labor has an 73% chance of forming majority government. The Coalition has a 5% chance of majority government. There is a 22% chance of minority government.

  • Armarium Interreta: Labor has a 68% chance of forming majority government. The Coalition has an 8% chance of forming majority government. There is a 24% probability for a minority government.

Wednesday, May 4, 2022

Are the polls starting to smell a little off?

Note:  This page has been updated. Unfortunately, I found some errors in my original calculations.

On twitter, I observed that the most recent 6 polls were in an unusually tight range. I calculate the two-party preferred vote share for Labor (working backwards from the most recent poll) as follows: Morgan 53.7, Essential 51.9, Newspoll 53.3, Resolve 53.9, Morgan 52.8, Newspoll 53.1. 

I was alert (but not yet alarmed) because the under-dispersion in the 2019 polls prior to that Election suggested there was something wrong with those polls. The 2019 two-party preferred (2pp) voting intention polls (as published) were implausibly close together, all within a one percentage point range of 51 to 52 per cent for Labor (48 to 49 per cent for the Coalition). Using the Chi-squared statistic for these polls (1.68) , we can see that the probability of this happening by chance alone is less than 0.01 per cent. This Chi-squared statistic is on the very edge of the Chi-squared probability density distribution for 15 degrees of freedom. That is to say if the polls were truly independent of each other, we would only expect to see this absence of variance on average in less than one in every 10,000 elections.


There is a rule of thumb in statistics and machine learning known as the bias-variance trade-off. In essence this rule of thumb says that reducing the variance in model predictions (opinion polls are examples of a statistical model) tends to see an increase in errors attributable to statistical bias. The opposite is also true.

The polls prior to the 2019 election had an implausible absence of variance. After the election, we discovered they also had a substantial bias, missing the final Election outcome by some 3.3 percentage points. As a result, not one pollster picked the eventual winner of the 2019 Election.


Returning to the 2022 Federal Election,
we are currently only looking at a collection of six polls, where the absence of variance has a one in five probability of occurring by random chance. At this point I am not concerned, but I am watching closely. 

My concern will rise if we see further polls in a narrow range. If the absence of variance in the 2022 polls reaches 2-sigma (two standard deviations - 95.45 percent) I would be worried. If it reaches 3-sigma (99.73 per cent) I would be very worried. At 4-sigma (99.9937 per cent) ... things would still be better than the 2019 Election ... but I would be alarmed at the state of polling. 

Update: Looking closer at the four pollsters that are tracking closely with each other since the election was called we are still not quite at 2-sigma for these polls.