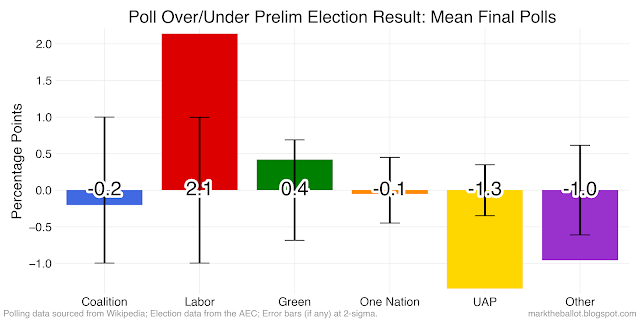
Although the count is only two thirds completed, we can start to look at how the final polls before the 2022 Australian Federal Election compared with the 95 per cent margin of error your would expect from random sample opinion polling. Note: I updated this post when the election count was completed.
Headline: While the two-party preferred (2pp) estimates from the pollster's final polls this election look good, all of the pollsters had some struggles when it came to the estimating the primary vote shares for the parties. Pollsters particularly had challenges with Labor's primary vote, the vote for the United Australia Party and the vote for Others.
In each of the charts below we have looked at whether to polls individually or collectively over or under-estimated the vote share seen so far in the 2022 Election.
To provide a benchmark for assessing the polls, I have also calculated the 95 per cent confidence interval based on the reported sample size on Wikipedia.
Caveats: First, the error bars in the following charts were calculated from the headline reported sample size, not the effective sample size reported by the pollster as a consequence of stratification and weighting. Second, these results are likely to change somewhat between now and when the count has been completed.


One question I have is whether the figures might be outside the historical margin of error (MoE calculated from RMSE on historical polling errors), in addition to being outside the theoretical margin of sampling error.
ReplyDeleteMy estimate is that the historical RMSE is about 33% higher than the theoretical RMSE for 2pp (theoretical ≈ 1.5, actual ≈ 2.0) - wonder what would the individual poll graphs look like if that was used instead?
Good questions - i have not looked at primary vote polling much in the past - but I suspect it will be very important in the future. Understanding it, and its propensity for error will be important.
Delete