Most of my refinements since yesterday's post have been to correct minor glitches in the code, and data transformations to make it work better with the Hamiltonian Monte Carlo method that is used in the PyMC software. But in broad terms the model is conceptually unchanged.

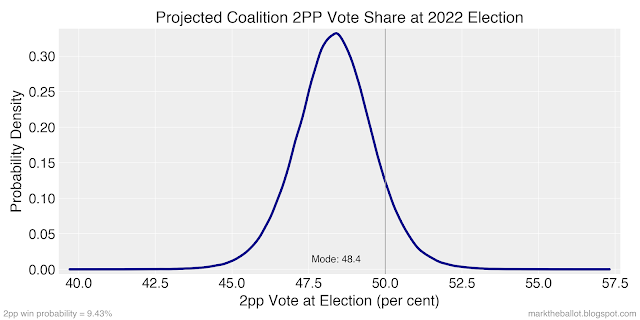
The first thing my model does is try and predict the two-party preferred (2pp) Election result, based on the mean of the polls over the past fortnight. The critical assumption I make here is that historically the polls have been increasingly inaccurate, the more favourable they have been to Labor. In plain English, a poll average in Labor's favor of 46 to 54 (roughly where we are now) is likely to see an election result more like 48 to 52. The solid red line in the next chart is the regression line. The dashed purple line is y = x. If the historic poll means were unbiased, they would be normally distributed around this dashed y=x line. Of note, all but one of the historic poll means was above the dashed line (ie. all but one had under-estimated the Coalition).


From the election outcome, I then look at the number of seats that each party would win if there were no independents or minor parties. Again I use a regression to do this. The regression line suggests the Coalition has a slight advantage over Labor in converting votes to seats.

My current prediction, if there were no independents and minor parties, is that Labor would notionally win between 67 and and 98 seats (94% HDI). The Coalition would win between 53 and 84 seats.
The third step is to estimate the number of seats that would be won by independents and minor parties (including the Greens). I do this with a regression as well. But this relationship is less robust. And it does not take into account the special factors that might be at play in this election. If we plug a 29 per cent other party primary vote (up from 25 per cent in 2019), the regression still only predicts 6.5 cross bench parliamentarians.

Because the polls were pretty much spot on for the past three elections, I don't bother with estimating the Other primary vote from the current polls.

I estimate the number of these non-mainstream party seats to be between 3 and 11 seats. My intuition is the model under-estimates this probability. In this election, it looks like the down-side risk is largely on the Coalition side. I would not be surprised if the Coalition got one or two fewer seats, and the cross bench grew from its current six to (say) seven, eight or perhaps even nine members.

Finally, I deduct these seats for independents and minor parties from the notional seat totals I created above for Labor and the Coalition. I assume that somewhere between 65% and 75% will be lost from the Coalition. This gives me the likely seats to be held by Labor and the Coalition.


Labor is likely to win between 65 an 96 seats. The Coalition is likely to win between 48 and 79 seats. Labor has a 73.2 per cent probability of forming majority government. The Coalition has a 7.5% probability. There is a 19.2 per cent chance of a hung parliament.

If you want to see how the sausage was made, the Jupyter Notebook is on GitHub. But please note this Notebook was written in a couple of days, and has not been rigorously tested nor tidied up.
Finally, there are no guarantees with this model. So, do not blame me if you place bets based on this model and you lose your money, that's your problem.
I think you may want to Monte Carlo others votes to seats rather than just assuming a regression. An others seat happens abruptly on a tipping point, when a major party comes in third.
ReplyDeleteFair point
Delete