The crossbench in the 2019 House of Representatives had six members: Adam Bandt (GRN/Melbourne), Helen Haines (Ind/Indi), Bob Katter (KAP/Kennedy), Rebekah Sharkie (CA/Mayo), Zali Steggall (Ind/Warringah), and Andrew Wilkie (Ind/Clark).
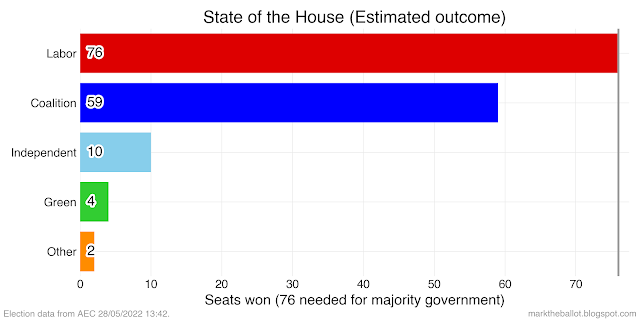
After the 2022 election the crossbench has 16 members. All of the crossbench members from the 2019 Parliament were returned. In addition there are 10 new members: Stephen Bates (GRN/Brisbane), Max Chandler-Mather (GRN/Griffith), Kate Chaney (Ind/Curtin), Zoe Daniel (Ind/Goldstein), Dai Le (Ind/Fowler), Monique Ryan (Ind/Kooyong), Sophie Scamps (Ind/Mackellar), Allegra Spender (Ind/Wentworth), Kylea Tink (Ind/North Sydney), and Elizabeth Watson-Brown (GRN/Ryan).

According to the two-party preferred (2PP) count of votes, the crossbench took nine seats from the Coalition and seven seats from Labor.

The notionally Coalition seats are as follows. The swings in this table are the swings in percentage points towards the Coalition (+), or away from the Coalition (-).
| State | 2PP Coalition Percentage | 2PP Labor Percentage | Swing | |
|---|---|---|---|---|
| Division | ||||
| North Sydney | NSW | 51.26 | 48.74 | -8.01 |
| Warringah | NSW | 51.43 | 48.57 | -0.69 |
| Kooyong | VIC | 54.18 | 45.82 | -2.21 |
| Goldstein | VIC | 54.80 | 45.20 | -2.99 |
| Indi | VIC | 55.26 | 44.74 | -7.47 |
| Curtin | WA | 55.60 | 44.40 | -8.35 |
| Wentworth | NSW | 55.92 | 44.08 | -3.93 |
| Mackellar | NSW | 58.60 | 41.40 | -4.62 |
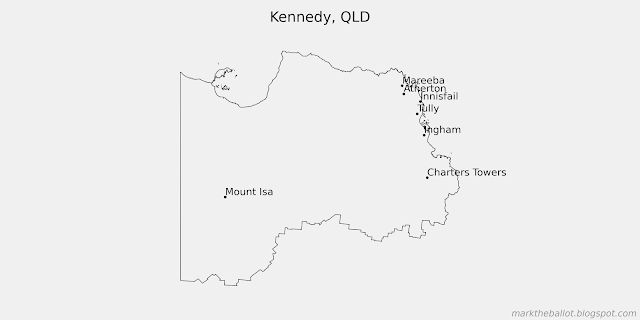
| Kennedy | QLD | 60.16 | 39.84 | -4.35 |
The notionally Labor seats are as follows.
| State | 2PP Coalition Percentage | 2PP Labor Percentage | Swing | |
|---|---|---|---|---|
| Division | ||||
| Mayo | SA | 48.41 | 51.59 | -4.13 |
| Ryan | QLD | 47.58 | 52.42 | -8.45 |
| Brisbane | QLD | 45.60 | 54.40 | -9.32 |
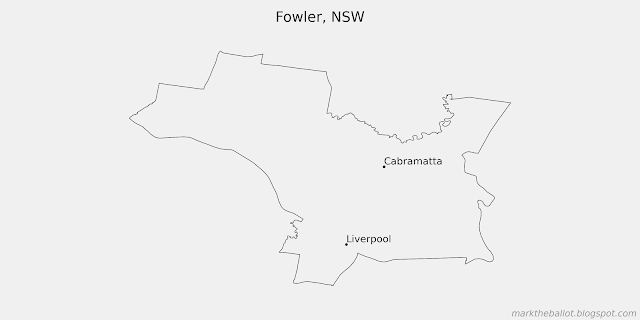
| Fowler | NSW | 44.28 | 55.72 | 8.27 |
| Griffith | QLD | 38.93 | 61.07 | -8.21 |
| Clark | TAS | 32.76 | 67.24 | -1.07 |
| Melbourne | VIC | 22.09 | 77.91 | -10.11 |
Of note, Fowler is the only one of these crossbench seats that saw a 2PP swing to the Coalition. Mayo, which is held by Rebekah Sharkie (CA) has gone from being a notionally Coalition seat to a notionally Labor seat, according to the two-party preferred count. Brisbane and Ryan in Queensland, now held by the Greens, have transitioned from being Coalition seats to being notionally Labor seats.
And a quick look at these seats ...