Saturday, April 30, 2022

Are the polls biased?

When you look at the two-party preferred (2pp) election outcome compared with the cloud of 2pp polls immediately prior to an election, it looks like the election result, more often than not, is more favorable to the Coalition than the preceding polls. To put it another way, it looks like the polls on average favour Labor. In the following chart, the election result (in the red/orange box), is typically above most of the polls (blue dots) in the five weeks immediately prior to an election.

If we look specifically at the average of all the 2pp polls in the 14 Federal elections from 1983 (the modern polling era), the Coalition outperformed the final two-week poll average 12 times. Labor outperformed this poll average twice. The following table has the difference between the average 2pp poll for the two weeks prior to the election, and the final 2pp Election result. A negative number indicates the final fortnight polls were on average more favourable to Labor than the election result. A positive number indicates that the polls were more favourable to the Coalition than the election result.

Election Year
Ave Poll Error (for polls concluded in the final 2 weeks before the election)
1983-1.300000
1984-3.400000
1987-2.316667
1990-1.466667
19931.618182
1996-1.941667
1998-0.087500
20010.100000
2004-0.877778
2007-1.500000
2010-2.192308
2013-0.455556
2016-0.327273
2019-3.270000

We can visualise this tendency to favour Labor in the polls as a probability density function, where the area under the curve sums to one. The statistical technique to construct this curve is known as a Kernel Density Estimate (KDE). It is clear, that on average, these polls collectively were a little over one percentage point favourable to Labor when compared with the final Election result.

The next long series of charts shows each of the elections and the way in which the rows in the above table were constructed. Feel free to skip past these charts if this is not your thing.


I have been thinking about whether I can model this bias, and whether I should model it. Using Bayesian techniques, I have found a Student's t-distribution that provides a good algebraic approximation of the probability density function above. So it can be modeled easily. For the nerdy, this distribution has a location of -1.255 percentage points (this is the historic pro-Labor bias), a scale factor of 1.44 percentage points, and 11.22 degrees of freedom.

I am more conflicted on whether I should model the pro-Labor bias. I have not found a compelling theory of action for how the historic bias arose. I assume that the pollsters would rather get the final election result correct (as this reflects well on their business), than to favour one side of politics or the other. It has also been reported to me that this bias does not exist in state government polling. I think this historical bias is unlikely to have occurred by chance alone. Nonetheless, if I don't know why it has occurred in the past, I cannot be confident that the driving factors will persist into the future.

I will think about this some more. If you have any compelling explanations for the historical bias, let me know in the comments below.

Finally, I want to thank Ethan and Rebecca at armariuminterreta.com who compiled this data. Ethan tells me that he in turn was assisted by William Bowe and Kevin Bonham.


Thursday, April 28, 2022

Some historical context

Although some pollsters are predicting that Labor will win 54 or 55 per cent of the two party preferred vote at the 2022 Australian Federal Election, historically this would be an unusual outcome. It is not impossible, but it would be unusual.


Tuesday, April 26, 2022

Ipsos 45-55 and Newspoll 47-53

Two new polls in the past 24 hours, one from Ipsos, and the other from Newspoll. This is the second Ipsos poll we have had since the 2019 election. The previous Ipsos poll was conducted between 30 March and 2 April. As published, both polls had the same two-party preferred (2pp) voting estimate as the previous poll in that pollster's series.

I prefer to calculate the 2pp estimate from the publish primary vote estimates myself. According to my calculations, Labor is ahead in Newspoll with 53.1 per cent and in Ipsos with 54.2 per cent of the 2pp vote. On this basis, Ipsos shows a small movement to the government from its previous result with Labor on 54.9 at the end of March. Newspoll is marginally (but not meaningfully) more favorable to the government, from a previous result one week ago of 53.3 per cent. 

These polls are consistent with a comfortable Labor win at the next election. 

We can see how the individual pollsters are tracking this election in the following charts. As I noted yesterday, the exponentially weighted moving average can be slow to recognise changes (at the right hand end of the series). The LOWESS regression can be overly influenced by the final points in a series, and at a time of change it may initially overestimate the scale of that change. Also note: the Ipsos series is not long enough to calculate a LOWESS regression. 


The Bayesian model seeks to aggregate the polls into a daily estimate of voting intention. This model assumes that the tendency of the individual pollsters to systematically overestimate or underestimate the poll result sums to zero. Another way of saying this is that the model assumes the pollsters are not biased on average. This chart includes Ipsos for the first time, so it is not directly comparable with previous outputs from the Bayesian model. Because we only have two data points from Ipsos, the model is less certain about the pollster effects from Ipsos.


The story here is much like the headline from the individual polls above. If Labor got 53.3 percent of the 2pp vote share at an election, it is most likely to win the election comfortably.

Monday, April 25, 2022

Election polling (ANZAC day update)

The election was called on 10 April, just over a fortnight ago. According to Wikipedia, there have been four national polls in that time. While the paucity of polling in Australia is a problem, there are some interesting trends.

First, so far we have not seen the extreme herding that occurred among pollsters in the lead up to the 2019 election. My calculation of the 2pp polls since the election was called range between Labor ahead with 51.0 per cent and 53.4 per cent (using preference flows from the 2019 election). Labor is more likely to highly likely to win the 2022 election, provided the actual 2pp at the election is in this range. My current working estimate is that Labor should win around 80 seats (of 151 seats), but I will firm this estimate up closer to the election.

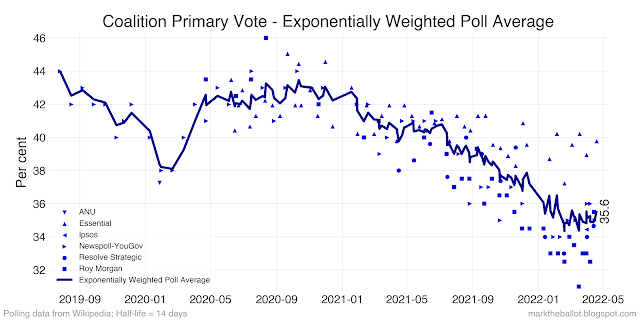
Second, we have seen a substantial tightening in the race. Two-party preferred (2pp) opinion polls for the Coalition have improved more than a percentage point, from their nadir earlier in 2022. 

This is not just something we are seeing in aggregate terms. It is also evident in the trends from each of the individual pollsters. I should note that in the next few charts, the exponentially weighted approach will be slower to recognise changes than the LOWESS regression. On the other hand, the LOWESS regression can be over-influenced by the final data points in a series, and at the end it can suggest a larger changes than has actually occurred.


The betting markets also suggest the race might be tighter than even the polls foreshadow. At 10.30am on ANZAC day, Labor was on \$1.70 to win. The Coalition was on \$2.10.

Third, the pollsters are all over the shop floor when it comes to the primary vote share for the non-mainstream parties (ie. the other party vote excluding the Coalition, Labor and the Greens). We have estimates ranging between 8.4 per cent and 16.8 per cent.


The divergence between pollsters on the other-party vote share could be significant when it comes to 2022 election. The other party primary vote has been growing in recent elections. If the trend continues, it means that Labor or the Coalition could form government with a record low primary vote. The old rules-of-thumb for the minimum primary vote necessary for majority government may not apply in this election.

However, the divergence between pollsters makes it hard to discern whether there is a trend in other party voting. Depending on the aggregation approach I apply, I get three different stories: (a) voting intention is at a record high 16.6 per cent; (b) it is down a couple of percentage points from a recent high, at 13.5 per cent; and (c) it is well down on the recent high at 12.9 per cent. This will be something to watch closely over the next four weeks between now and the election.


Nonetheless, there is speculation that some high profile seats may fall to other party candidates at the coming election. The betting markets have independents ahead (or a close second, under $3) in the following seats: Mackeller (NSW), North Sydney (NSW), Warringah (NSW), Wentworth (NSW), Goldstein (Vic), Indi (Vic), Kooyong (Vic), Nicholls (Vic), Curtin (WA), and Clark (Tas). Also, minor parties are well placed to keep Kennedy (Qld), Melbourne (Vic), and Mayo (SA). It is more likely than not that the total number of Greens, other minor parties and independent seats will grow following the 2022 election.

Fourth, the Greens primary vote polling is up a little, but largely unchanged since the 2019 election. 


Fifth, the Coalition has seen a small increase in its primary vote, and Labor has seen a slightly larger decrease. In respect of the LOWESS and exponentially weighted charts, please note the caveats from above:


Finally, there is always the nagging doubt that the polls could be wrong again (as they were in 2019). Federally, there is a long history of the opinion polls being slightly more favourable to Labor (on average, but not at every election) when compared with the final vote count. However, it should be noted that there are new entrants to the polling market, and some long-term players have left the market. Most pollsters have changed their methodology following the 2019 polling failure. Hence, there is a possibility that the pollsters have over corrected their methodologies following 2019, and today's polls are actually leaning to the Coalition. 

If you have read this far, well done. You might be interested in Buckley's and None, which uses a statistical model to predict the number of seats each party should win. [Disclaimer. I have no relationship with Buckley's and None, but I like the approach they took to seat estimation]. 

Update: I also like the model at . [Disclaimer, I have no relationship with the authors of this model.