Showing posts with label LOESS. Show all posts

Monday, November 20, 2023

Updated polling charts

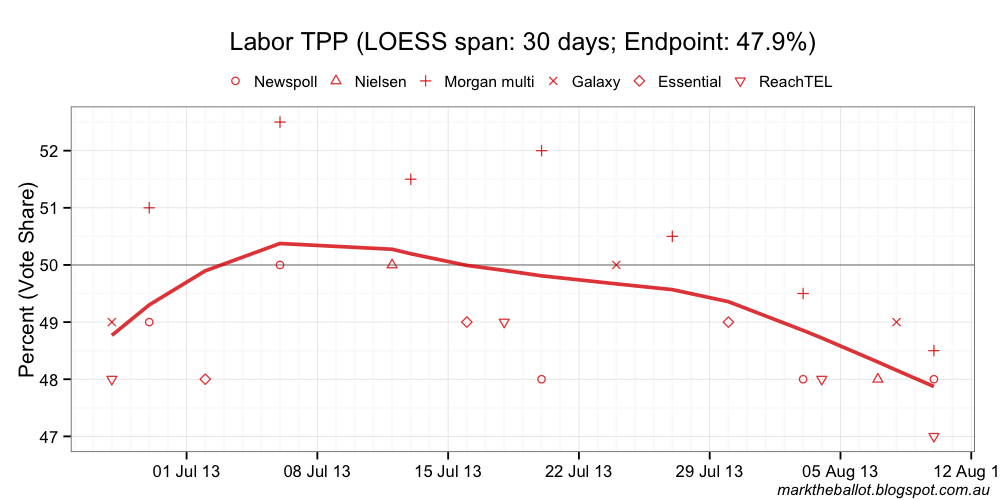
The updated localised regression chart suggests that two-party preferred voting intention for Labour continues to decline. 

However, this decline is not as marked on the Bayesian Gaussian Random Walk (GRW) model. This model assumes that:

  • how the whole population will vote on any given day is very similar to the day before (this is the Gaussian Random Walk in the model)
  • opinion polls provide an irregular and noisy indication of how people would vote; and
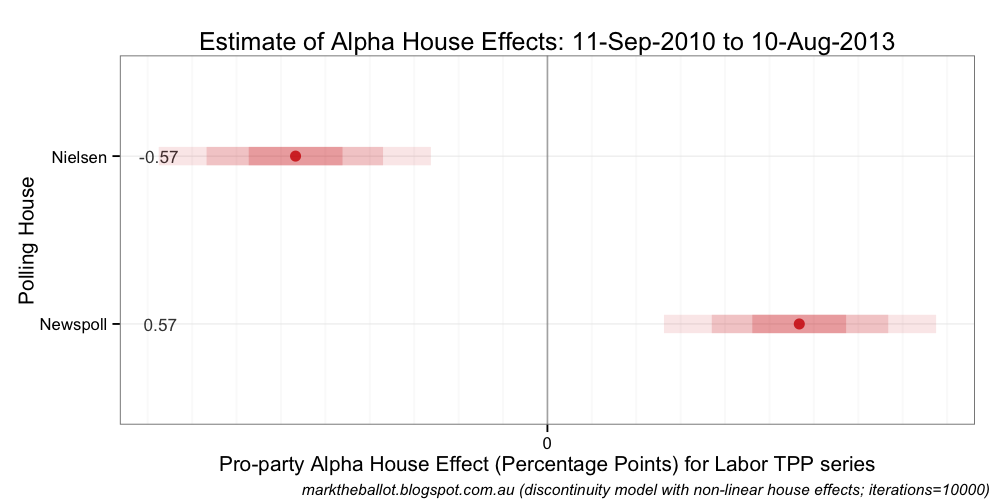
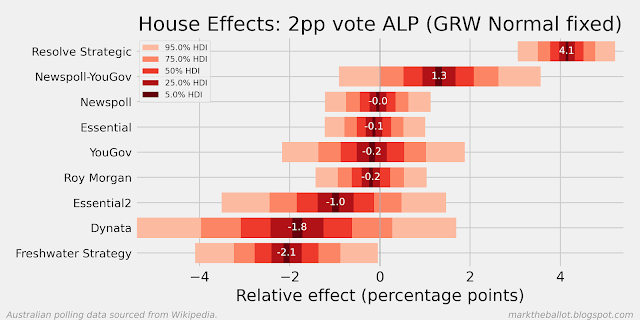
  • the individual pollsters have unintended methodological biases that tend to favour one party over another over time. For the purposes of the model, these house effects are assumed to cancel each other out across all pollsters, ie. they sum to zero across all of the polling houses. 
With these three factors, the model finds the most likely day-to-day pathway for population voting intention. 


The Gaussian Process (GP) model, has a similar approach to identifying and managing house-effects as the Gaussian Random Walk, but it models voting intention using a covariance matrix, with a higher covariance for polls that are closer together in time. The covariance function I used is the exponentiated quadratic kernel (with a length scale of 50 - "ell" in the denominator). This model produces a similar aggregation result, although it suggests that the recent poll movement away from Labor is less intense.


Collectively, the central tendency of these models can be seen in the following chart. The following chart also includes a left-anchored series (labeled GRWLA) which is a Gaussian Random Walk that has been left-anchored to the election result at the previous election. The house effects in the the GRWLA model do not sum to zero.


Turning to primary votes. The most significant trend is Labor's decline. The Coalition is up on where it was six months ago (but may be in decline at the moment). The Greens may be up on where they were six months ago. The vote for others and independents also looks up.


The data for these charts is sourced from Wikipedia. Before analysis, the polling data is treated to ensure that:
  • undecided respondents are proportionately allocated where necessary, and 
  • the two-party preferred and primary votes are normalised to sum to 100 per cent exactly. 
The notebooks that produced these charts are available on my github site.

Wednesday, August 28, 2013

Midweek update

Today's ReachTEL is consistent with Labor arresting its decline in the polls. However, at 47-53 in the Coalition's favour, the polls are still predicting a sizable Coalition win.


Also, something we have not done for some time is look at how the primary votes have been tracking since Kevin's restoration. For this exercise, I will start with a simple 30-day LOESS regression to plot the trend.


We can look at the primary vote trends from the individual pollsters to get a sense of how consistent or inconsistent the trend is across polling houses:


And we can pop the primary votes into a Bayesian model ... which among its constraints, seeks to ensure the four types of primary vote (Coalition, Labor, Greens and Other) sum to 100 per cent.


Monday, August 12, 2013

Update: Newspoll 48-52 and Morgan 48.5-51.5

Today we have the third Newspoll in a row with 48-52 for the Coalition. More surprising has been the Morgan result with the Coalition ahead 48.5-51.5, calculated using preferences flows from from the 2010 Election. The Rudd restoration polls follow.


Using LOESS to take some of the noise out, the individual polling houses tell a story of a two to four week honeymoon, followed by a decline in two party preferred (TPP) voting intention for the ALP. (Note: with only two data points, I do not calculate a LOESS for Nielsen).


Collectively, the 30 day LOESS picture is as follows:


Caveats: the LOESS technique can be overly influenced by outlier data points at the end of the series. Today's endpoint is probably overly influenced by the last ReachTEL poll. It may also be overly influenced by the Morgan collapse, which at 3.5 percentage points (peak to trough) is almost double the next house at 2 percentage points.

Turning to the aggregation, we have:


Caveat: The zero line in the house effects chart is the average bias across the six polling houses I am tracking. You will need to come to your own view about where the actual level of systemic bias across the polls actually lies. At the 2010 Election (with a different set of pollsters), the population voting intention was about one percentage point more in the Coalition's favour than the pollster average (see here).

Because I have a soft spot for the grand old dames of Australian opinion polling, the Nielsen and Newspoll only (non-linear) aggregation follows ...


I will do another post tonight, after I have digested the Essential poll. (Update: perhaps Tuesday evening, as the data does not appear to have been released on Monday)

Newspoll in full


Around the web


Kevin Bonham has written a pretty good field guide to Australian opinion pollsters.

The ABC has an amusing vote compass thing.

Simon Jackman's tracking of betting markets suggests that last night's debate was not a game changer. For the three markets Simon tracks, things were essentially unchanged following the debate on the evening of 11 August.

Australian Political Betting, argues that while Labor won the debate with the pollsters, the Coalition won with the punters. To be fair, while more bookies moved in the Coalition's favour, there was not much movement. I suspect a bit of money come on following the debate, which has closed the field a little (the implied probabilities were all much closer following the debate).

Ben Raue has completed his seat-by-seat guide to the House of Representatives.