Monday, October 30, 2023

Are the polls biased?

I have coded Bayesian aggregations of the polls for the 2025 Federal election.  A key assumption in that aggregation model is that the polls are on average unbiased. While an individual pollsters may have a house effect, collectively I have assumed these house effects sum to zero. 

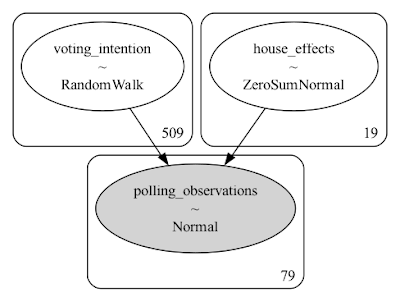
Another way of looking at the polls is to anchor the model for daily voting intention to the result at the previous election. Under this approach, I assume that there is a collective polling error, and the model allows us to determine the size of that polling error. The model is as follows:


The results for the two party preferred ALP voting intention are as follows.


We can see that on average, if we anchor our model of day-to-day voting intention to the result on election day in May 2022, that our estimate is 1.3 percentage points less favourable to Labor. However, while the polls appear to have a pro-Labor bias, we need to be cautious. Partly because the model is less constrained than the previous model, and partly because there are few polls on the left hand side, the confidence intervals associated with the model are wider than for our zero-sum house effects model. In particular, the model results suggest that the systemic poll error might be anywhere between -1.0 and +3.5 percentage points in Labour's favour. Therefore, while it is more likely than not that the two-party preferred (2pp) polls favour Labor, with these results we cannot be certain. 

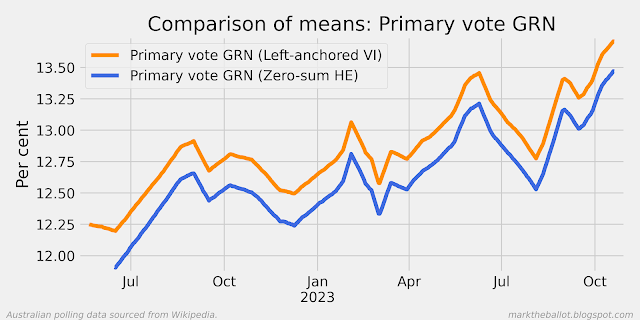
The only series where the model is certain that the polls collectively are biased is in respect of Labor's primary vote shares, where the polls appear to be 2.7 percentage points collectively more favourable to Labor. We can be confident as the associated probability density chart below does not have zero within the highest density interval (HDI). While we cannot be certain, it does look like it is more likely than not that some bias is also evident with the Coalition and Other parties primary vote share. 


Saturday, October 28, 2023

Betting markets

I have started tracking the betting market at sportsbet.com.au for the next Australian Federal Election. The specific question I am tracking is the party which will supply the Prime Minister following the next election. I plain to capture a snapshot of the relevant odds daily, sometime around midday. I will not be reporting on the "Any other party" odds, as I consider the results to be skewed by the long-shot bias.

As I have only been tracking this for a day, the charts at this stage are not very interesting. 


Nonetheless, I was a little surprised at the 60/40 probabilities. My prior, before looking at the odds, was that it is very unusual for a first term government to lose their first election as a government. 

Thursday, October 26, 2023

Poll aggregation

I have updated my Bayesian poll aggregation models for the 2025 Australian Federal election. The aggregation suggests that Labor would win an election if one was held now. Nonetheless, voting intention for Labor is down from its peak around 56 per cent earlier in the year.


There has also been some movement in the primary voting intention. The non-mainstream other primary vote share is largely unchanged over the year. The Green vote is up. The Coalition vote is up. And Labor's vote is down.


Perhaps the largest movement over the year is in the satisfaction with Prime Minister Albanese's performance. The following charts are based on a 3-month localised regression.


The remaining attitudinal charts show less change.


Friday, October 20, 2023

Voice Referendum 2023

Updated on 25 October and 2 November 2023:

Going into the the Voice Referendum, collectively the polls suggested that the referendum would be lost. There was not one poll predicting a win in the last couple of months before the referendum. This was a win for polling.

Using a Bayesian technique, we can pool the polls. The technique assumes that the voting intention on one day is much like the day before. We can only know the actual voting intention on referendum day. Prior to the referendum, the model assumes the voting intention broadly tracks the opinion polling. The model also assumes that each pollster has an inherent bias. This bias is referred to as an house effect. This is not to suggest that any pollster is deliberately biased. Rather, the bias comes about from systemic factors such as how individual pollsters select and interview their sample, how results are weighted, and so on. However, collectively, this model assumes these biases cancel out (they sum to zero). 

The pooled polls (assuming that individual pollster bias cancelled out) predicted the yes vote would be around 43.4 per cent immediately before the referendum.


As it turned out, this was optimistic. It is now a few weeks since the Voice Referendum was lost. While the count is still progressing, this afternoon (2 Nov) it stood at 39.94% for Yes and 60.06% for No. It is likely that the final count will not differ substantially from this result. 

If we run a similar Bayesian model with the only difference being that this model is pegged to the final referendum result, we can calculate the systemic polling error across all pollsters both individually and collectively.


From the house effects chart immediately above, we can see that (over the entire period under analysis) many pollsters had zero bias within their 95% HDI on average. Nonetheless, some pollsters appear to have over-estimated the yes vote by up to 15 percentage points on average, or underestimated it by around 7 percentage points. 

This was particularly evident with the polling in the first few months of the new Labor government. It is possible that these early polls gave the government false confidence in respect of the winnability of the referendum, and they may have influenced the strategies and tactics adopted by the government towards the referendum. 

Collectively, the modelling suggests that all pollsters were on average 3.4 percentage points too favourable to the level of yes voting intention over the period under analysis. 

Of course, these results are model based, and include a number of modelling assumptions. Care should be taken when interpreting the results. 

The notebook for this analysis can be found here. The data for the analysis came from Wikipedia.

For another perspective see Kevin Boneham.

F