Because betting market odds can be expressed as probabilities, they can be used in Monte Carlo simulations to reflect the election outcome that punters think most likely. However, there are a couple of technical issues that need to be considered. One is simple; the other, less so.
Bookmakers make their money by ensuring that whomever wins, their outlays will always be less than their takings. A bookmaker adjusts her odds as bets are laid to maintain a margin for herself. Fair enough, bookmakers need to cover their costs and make a profit. This is variously known as the bookmaker's overround, margin, vigorish, vig or juice. To get fair probabilities from the bookmaker's odds, we need to correct for the bookmaker's margin.
The more challenging technical issue is what is known as the Favourite-Longshot Bias (FLB). First reported by R M Griffith in the American Journal of Psychology in 1949, FLB notes that on average short odds under-estimate the probability of winning and that long odds over estimate this probability. As a consequence, bets placed on higher-valued odds (the longshots) offer worse rates of return than bets placed on lower-valued odds (favourites). This tendency in betting markets has been empirically validated many times.
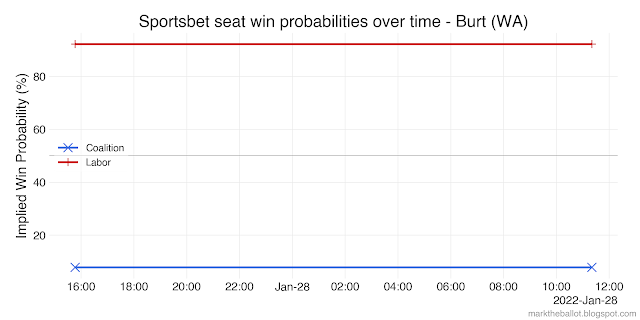
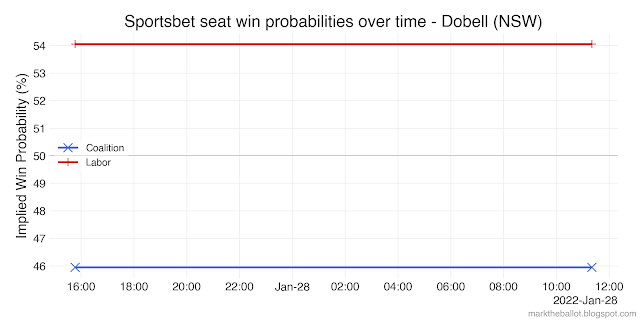
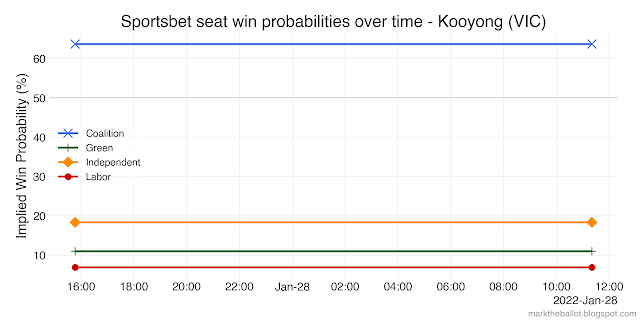
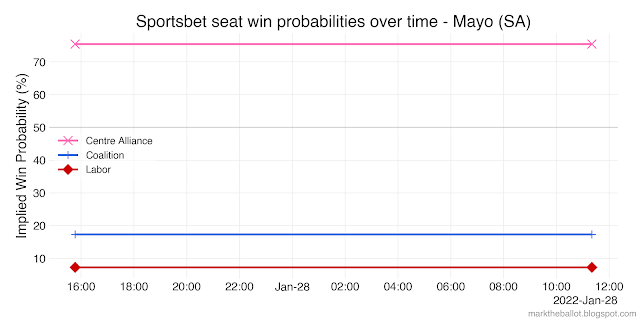
It is evident in our data. In almost every seat, sportsbet offers odds of \$101 on the United Australia Party (UAP) winning the seat. This is an individual seat win probability of 0.0099009900990. In a 151 seat Parliament, the most likely outcome for these same odds across every seat is the UAP winning one or two seats in the next election. Sorry, but I would be surprised if the UAP won any of these seats, with those odds. Consistent with FLB, these odds of \$101 overstate the UAPs probability of winning.
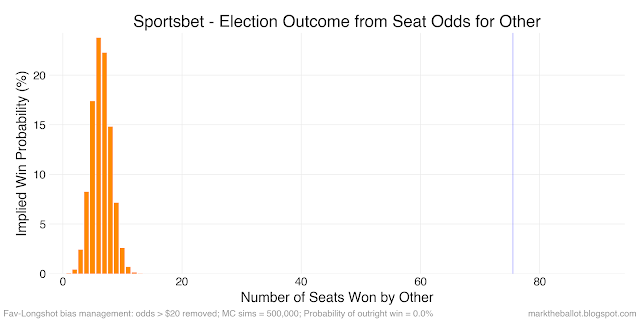
If I don't adjust the bookmaker's odds for FLB, the Monte Carlo simulations ends up with an implausibly large number of Greens, independents and other minor parties winning seats in the House of Representatives, as evident in the following charts.
So what adjustments should I make? One option is to arbitrarily ignore longshot odds over a certain value (say \$20). This is the approach I took for the 2019 election.
While this yields a more plausible simulation, the cut-off is arbitrary. Another option is to transform the odds so that the higher valued odds are made even higher to correct for FLB. I have considered two transformations. First multiplying the raw-odds by their square root (this is the same as raising the raw-odds to the power of 1.5). Second, squaring the raw-odds (which is the same as raising the raw-odds to the power of 2).
The next set of charts come from the Monte Carlo simulation where the raw odds were multiplied by their square root. The results are similar to the charts above where longshot odds over \$20 were ignored.
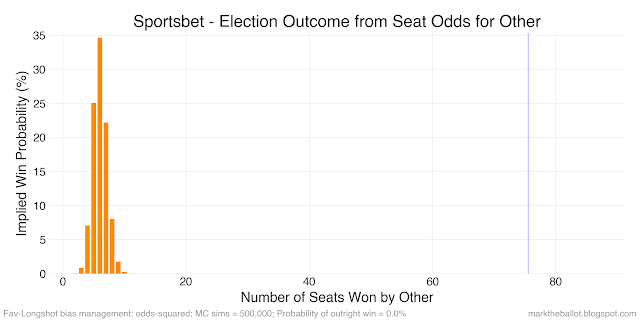
The final treatment I considered was squaring the raw-odds, before converting them to probabilities and standardizing these probabilities so that they sum to one in each seat.
I am still deciding which transformation of the raw-odds is best. While the squared approach yields probabilities for the number of seats won by the Greens and Others more in line with the current parliament, the variance of the probability distributions for all four groups has been reduced. The bias-variance trade-off suggests that we need to at least consider the possibility that we might be over-fitting the betting market data. Nonetheless, for the moment, I plan to use this squared-odds approach for managing the favourite-longshot bias (FLB) within the Monte Carlo simulations. Otherwise, the number of seats won by the Greens and others still seems too high. But I will review this approach from time to time.
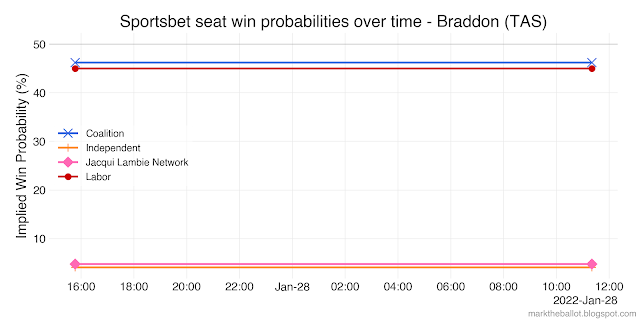
For the individual seat outcome probabilities, I will take the less aggressive approach of multiplying the raw-odds by their square root before calculating the probabilities and adjusting for the bookmaker's margin.
If you have alternate/better treatments for FLB, please drop a note in the comments below and argue your case.
Caveat
A couple of people have noted that I am using independent draws in the above Monte Carlo simulation. They argued, because voting across electorates is correlated, I should have used dependent draws, or correlated draws. It is a fair points, but this requires substantial work to understand and model the dependency structure. I have added this to my to do list. One of my interlocutors provided a couple of useful links: