Sunday, June 30, 2013

And Galaxy makes three

Today's Galaxy, means we now have three polls telling much the same story.


The bias adjusted polls are as follows. One of the three is close to 50 per cent TTP for Labor. Two are closer to 48 per cent.


The Rudd effect comes back to a touch under 5 per cent.


And, if there is a nationally consistent swing (almost possible) the result would be ...


Friday, June 28, 2013

Adding in ReachTEL

This morning's ReachTEL was the third national poll in this series. Having three polls allows me to drop the ReachTEL series into the Bayesian aggregation with some sense of the bias for the series. (I can drop in single polls which are not part of a series, but this does not give me a sense of the house effect).

The result is an aggregation that suggests the population two-party preferred (TPP) voting intention might be closer to 49.5 per cent for Labor and 50.5 per cent for the Coalition.


All-in-all, this result suggests a close election.


Because the ReachTEL series (with just three polls) appears to have a moderate Coalition bias, I have excluded it from the sum-to-zero constraint on house-effects (just like I previously excluded the Morgan face to face poll because of its Labor bias). I will review this decision when I have seen a few more ReachTEL polls.


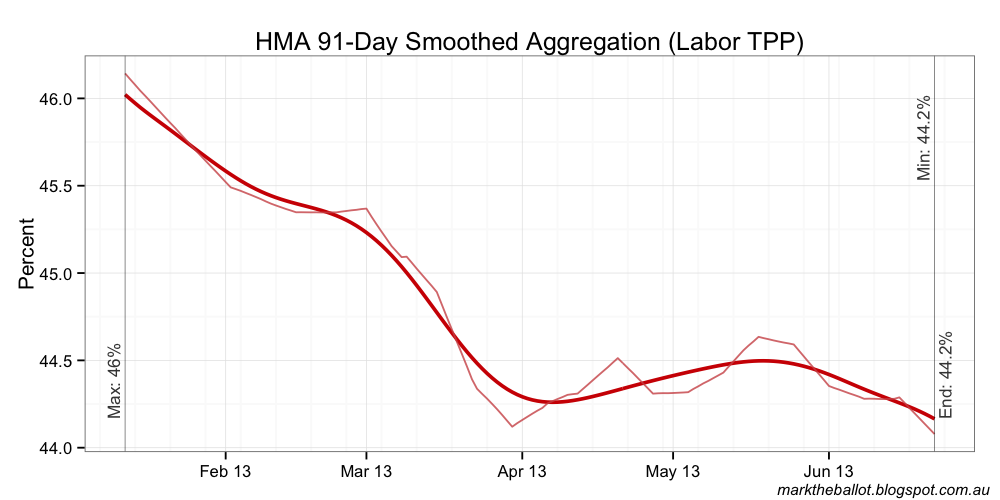
Of note: once bias adjusted, the latest ReachTEL poll is pretty much 50-50 in round terms (See the right-most data point in the next chart). 


Adding the ReachTEL poll suggests that the Rudd Resurrection Effect (RRE) might be closer to 5.1 percentage points. Half the RRE samples from the aggregation fell between 4.5 and 5.7 percentage points.


Finally, for the nerds, the updated JAGS code:

    model {
        ## Based on Simon Jackman's model, with an additional element for
        ## the various rounding effects of the different polling houses
        ## and a sum-to-zero constraint on house effects 
        ## Update: also provides for a discontinuity with the Gillard to Rudd transition. 
    
        ## -- observational model
        for(poll in 1:NUMPOLLS) { # for each poll result
            roundingEffect[poll] ~ dunif(-houseRounding[poll], houseRounding[poll])
            yhat[poll] <- houseEffect[house[poll]] + walk[day[poll]] + 
                roundingEffect[poll]
            y[poll] ~ dnorm(yhat[poll], samplePrecision[poll]) # distribution
        }
            
        ## -- temporal model
        for(i in 2:PERIOD) { # for each day under analysis ...
            #walk[i] ~ dnorm(walk[i-1], walkPrecision) # AR(1) 
            day2DayAdj[i] <- ifelse(i==DISCOUNTINUITYDAY, walk[i-1]+discontinuityValue, walk[i-1])
            walk[i] ~ dnorm(day2DayAdj[i], walkPrecision)
        }

        ## -- sum-to-zero constraint on house effects (ignoring Morgan F2F/ReachTEL)
        #houseEffect[1] <- -sum( houseEffect[2:HOUSECOUNT] ) + houseEffect[MORGANF2F]
        #houseEffect[1] <- -sum( houseEffect[2:HOUSECOUNT] )
        houseEffect[1] <- -sum( houseEffect[2:HOUSECOUNT] ) + houseEffect[REACHTEL]

        ## -- priors
        sigmaWalk ~ dunif(0, 0.00250)         ## uniform prior on std. dev.  
        walkPrecision <- pow(sigmaWalk, -2)   ##   for the day-to-day random walk
        walk[1] ~ dunif(0.01, 0.99)           ## initialisation of the daily walk
        discontinuityValue ~ dunif(-0.2, 0.2) ## uninformative prior

        for(i in 2:HOUSECOUNT) { ## vague normal priors for house effects
            houseEffect[i] ~ dnorm(0, pow(0.1, -2))
        }
    }

Thursday, June 27, 2013

Polling discontinuity post Gillard

Julian King emailed me today with an update to his model allowing for a discontinuity in public voting intention with the transition from Prime Ministers Julia Gillard to Kevin Rudd.

Clearly, circumstances require me to make a similar adjustment to my Bayesian aggregations.

I have used the snap Morgan poll to test my updated aggregation with the Gillard-Rudd discontinuity. This is only a test, as the latest Morgan poll is an SMS poll (not the multi-mode series the Bayesian aggregation expects).  I will back-out this SMS data from the model when further polling data becomes available.

Anyway, I thought it would be interesting to provide the charts from this test, as well as the JAGS code I am using. It certainly suggests a much more competitive election contest. With all the caveats of data inconsistencies, and only having the results from one poll, our very early estimate of the Rudd Resurrection effect is 4.7 percentage points. 


    model {
        ## Based on Simon Jackman's model, with an additional element for
        ## the various rounding effects of the different polling houses
        ## and a sum-to-zero constraint on house effects 
        ## Update: also provides for a discontinuity with the Gillard to Rudd transition. 
    
        ## -- observational model
        for(poll in 1:NUMPOLLS) { # for each poll result
            roundingEffect[poll] ~ dunif(-houseRounding[poll], houseRounding[poll])
            yhat[poll] <- houseEffect[house[poll]] + walk[day[poll]] + 
                roundingEffect[poll]
            y[poll] ~ dnorm(yhat[poll], samplePrecision[poll]) # distribution
        }
            
        ## -- temporal model
        for(i in 2:PERIOD) { # for each day under analysis ...
            dayToDayAdjust[i] <- ifelse(i==DISCOUNTINUITYDAY, walk[i-1]+discontinuityValue, walk[i-1])
            walk[i] ~ dnorm(dayToDayAdjust[i], walkPrecision)
        }

        ## -- sum-to-zero constraint on house effects (ignoring Morgan F2F)
        #houseEffect[1] <- -sum( houseEffect[2:HOUSECOUNT] ) + houseEffect[MORGANF2F]
        houseEffect[1] <- -sum( houseEffect[2:HOUSECOUNT] )

        ## -- priors
        sigmaWalk ~ dunif(0, 0.0025)        ## uniform prior on std. dev.  
        walkPrecision <- pow(sigmaWalk, -2) ##   for the day-to-day random walk
        walk[1] ~ dunif(0.0, 1.0)           ## initialisation of the daily walk
        discontinuityValue ~ dunif(-0.15, 0.15) ## uninformative prior
        
        for(i in 2:HOUSECOUNT) { ## vague normal priors for house effects
            houseEffect[i] ~ dnorm(0, pow(0.1, -2))
        }
    }

Tuesday, June 25, 2013

Technical adjustments

Up until February this year, Morgan provided three poll series: a regular (usually reported fortnightly) face to face series (which typically had a sizable pro-Labor bias when compared with other polls); a less-regular telephone poll series (which was more in line with other polls); and an infrequent SMS series. From March, Morgan replaced these various series with a single muli-mode poll, which has been comparable with other polling houses (but a touch over-dispersed for the sample size).

Of the three series, I had used two in my six-month, Bayesian aggregations: the phone series and the face to face series. With the effluxion of time, I dropped the Morgan phone poll some time ago. It is now time to drop the Morgan face to face poll from the aggregation.

To enable comparison, I will provide some side-by side charts of the current six-month aggregation with, and without the face to face poll. The first three charts include data from the five face to face polls in 2013.


The next three charts exclude the Morgan face to face polls.


Out of interest I looked at the aggregation with both the Morgan F2F and Essential series removed. I remain disturbed by the under-dispersion in the Essential poll series. I am also disturbed by the muted movement in the Essential series over time compared with the movement of other poll series. While it might be the case that Essential is right and the other polling houses over-state movements in public opinion; on the balance of probabilities, I suspect Essential is under-responsive.


At this stage, I will leave Essential in the aggregation. Given the polling, a displacement by 20 (or even 50) basis points is not that significant to the clarity of the overall result.

Monday, June 24, 2013

Weekly aggregation 44.3 to 55.7


Newspoll 43-57

Today's Australian has the latest Newspoll. The headline two-party preferred (TPP) vote share estimate is one percentage-point improved for the Government compared with three weeks ago. Nonetheless, a TPP result of 43 per cent for Labor would be devastating at an election.

Let's start our look at today's Newspoll with the primary vote shares. Of note: the Greens and Other votes are heading in different directions. And those intending to vote for mainstream parties (Coalition or Labor) is in decline, suggesting a growing level of dissatisfaction with both major parties. While the media has focused on the sub-30 primary vote share for Labor in today's polls, Labor has had worse this term.


At 57 per cent, the trend two-party preferred vote for the Coalition may be peaking.


Turning to the attitudinal questions, both leaders appear to have plateaued at their current level of dissatisfaction.


And finally, the question on who would be the better PM: which is running as strongly as it ever has in Abbott's favour.


Tuesday, June 18, 2013

Weekly aggregation

While the gender splits in yesterday's Nielsen poll were unfavourable for the government. The splits in the most recent Morgan poll were favourable. According to Morgan:

Analysis by Gender this week shows both genders swinging towards the ALP but with a wide divergence between men and women. Women are now evenly split on a two party preferred basis with the ALP (50%, up 4%) level with the L-NP (50%, down 4%) while men still strongly favour the L-NP (56.5%, down 2%) cf. ALP (43.5%, up 2%).

One of the reasons I aggregate polls is to filter out the noise and reveal the underlying signal. My suspicion is that the most recent movement to the Coalition in Nielsen, and the recent movement to Labor in Morgan are both reflective of the normal variability in polling data. Behind the stochastic perturbations from individual polling houses, I suspect the underlying population voting intention parameter is largely unchanged on last week.

While the poll aggregation (see below) is better news for the Government than a plain-face reading of yesterday's Nielsen poll, it still points to a comprehensive loss at the September election.


Monday, June 17, 2013

Nielsen poll: 43 to 57

Rather than wait until tomorrow for the weekly aggregation, when all of the week's polls are in, I thought I would give a foretaste today, using just Galaxy and Nielsen. I will update the aggregation further tomorrow.

The Nielsen poll particularly caught my eye with its gendered analysis.


I liked what John Stirton had to say in the AFR (pay-walled).  In short, he noted the average of the polls since February has been around 44 to 55 (for the Coalition), and this result is within the margin or error of that average. He also noted that while the hypothetical scenario polls suggest Kevin Rudd might poll better than Julia Gillard, these polls do not take into account the context and consequences of change.

My key Nielsen charts follow.


And on to the aggregation ...