Friday, May 20, 2022

Poll round-up

The polls have tightened in the last week of the 2022 Australian Federal Election campaign (albeit off a set of polls in early May that were more favourable to Labor than the late April polls). 


But some of this tightening is a little perplexing. The Ipsos poll has attributed "undecideds" for the first time this election cycle. Compared with the previous Ipsos poll from early May, which had seven per cent undecided, six of those seven broke for the Coalition in the primary votes and one for Labor. Labor's two party preferred (2pp) vote share according to Ipsos has moved four percentage points from 57 per cent in early-May to 53 per cent in mid-May. Using the primary votes and 2019 preference flows, I have the latest Ipsos poll at 53.6 per cent.

Resolve Strategic is the other pollster showing a large movement between its previous poll and its latest poll. In late April, Resolve had Labor's 2pp estimate at 54 per cent. In mid-May it is three percentage points lower at 51 per cent. 

Because of this late movement, I get quite different results when I model the 2022 election based on the last two weeks of polling, or just the last week of polling. From the last two weeks of polling (which includes the Ipsos poll with Labor on 57 per cent) I give Labor a 74 per cent chance of winning the election outright.

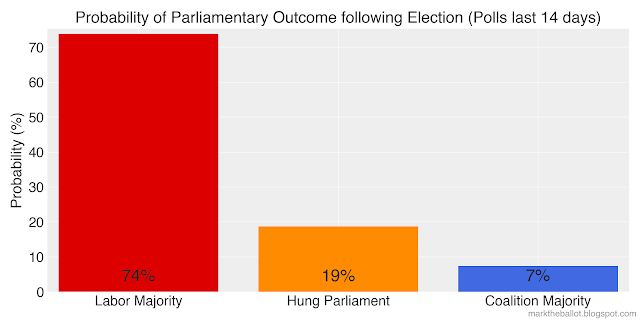
From the polls in the final week, I give Labor a 59 per cent probability of winning government outright. The Coalition's probability improves from 7 per cent to 15 per cent.

Let's go through the detail of each of these runs (on the exact same model) in some detail.


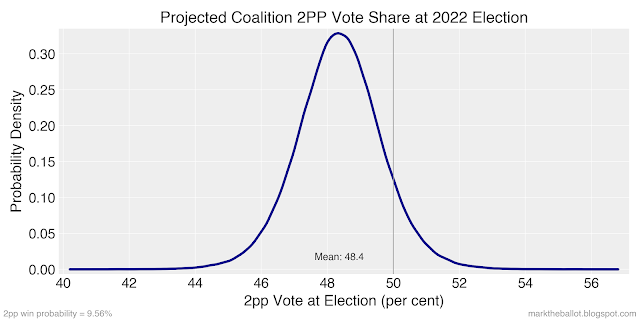
Polls over the past 14 days

We start with the regression for converting the poll mean into an election outcome. In this step we convert the 14 day 2pp poll mean for the Coalition of 46.4 per cent to an election outcome of 48.4 per cent.


Next we estimate the number of other party seats in the House. As I have stated before, this is the weakest part of the model. The relationship in the historical data is week. Also. note that I am making a projection based on an out-of-sample data point (always problematic). My best guess is that we will have seven cross-bench members in the next Parliament.

Finally, using a votes to seats regression and some simple math, we can estimate the number of seats for Labor and the Coalition.


Polls over the past 7 days

We can repeat this process for the polls in the past seven days. The regressions are slightly different, but the steps are the same as above. The big change is that we are now estimating a much closer 2pp result from the election. [I should note they regression charts provide a simplified cross check from the model, and that is why there are some very minor differences between the two].


Other party votes:


And then seats in the House:

 
Of these these two sets of results, I am inclined to lean towards the 7 day result as being more accurate. 
 

How we compare with others

My 7 day result (above) is similar to Buckley's and None.

The Australian Election Forecasts is a little like my 14 day result above. However, their mid range estimate is for a cross-bench of 11 seats - 2 Greens and 9 others. I have it 7 seats.

Ethan and Rebekah at Armarium Interreta are somewhere between my two results above. 

The usual caveats

The estimate of cross-bench seats in Parliament is the weakest element of this model. My intuition is that there are special factors at play this election that are likely to see more independents take seats, primarily from the Coalition. 
 
If you want to see how the sausage was made, the Jupyter Notebook is on GitHub.

Finally, there are no guarantees with this model. It has been hastily put together in the last week of an election campaign. It has not been back-tested. It is a macro-level model in nature. So, do not blame me if you place bets based on this model and you lose your money, that's your problem.

No comments:

Post a Comment