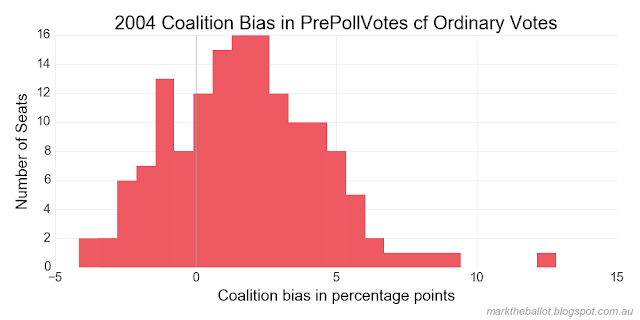
From this data it would appear at all elections since 2004, early voters (ie. declaration pre-poll and postal voters) typically favour the Coalition in comparison with ordinary voters in their home seat.
Provisional voters appear to favour the Coalition's opponent (which was Labor in the vast majority of these TCP cases). Absent voters are also more likely to vote against the Coalition when compared with ordinary voters in their home electorate (this trend appears to have intensified over time).
As a result, the final vote count (some two weeks after the election) looks more favourable to the Coalition than the ordinary vote count on election night might suggest. This is because the early voters outweigh (in both the extent of bias and the number of voters) the tendency of absent and provisional voters. (See yesterday's post for the proportion of votes by vote type for each election since 2004).
Sorry, but there are a lot of charts, which I will group by election year.
In looking at the histograms, look to where the 0 (zero) bias point lies in comparison with the peak or central tendency of the distribution. In the line charts, each line is a seat; look to whether they typically dip up or down compared with the ordinary votes.
2004
2007
2010
2013
2016
Note: These charts do not include Coalition v Coalition, Labor v Other nor Other v Other TCP outcomes where they have occurred.
Update 30 October and 2 November 2016
There were some glitches with the above charts which have been corrected.I have further explored these issues in a second post.


No comments:
Post a Comment