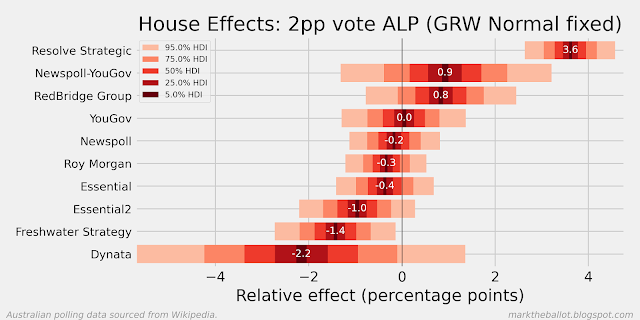
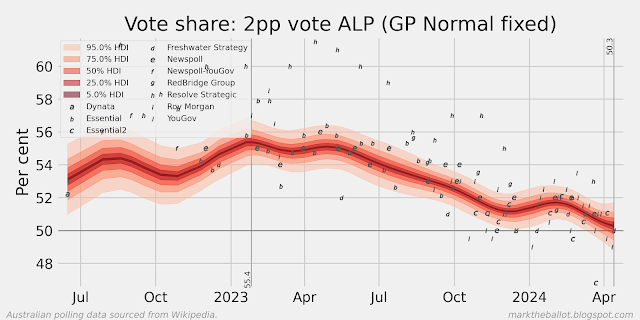
I run a number of Bayesian models of voting intention for the next Australian Federal election.
The first is a Gaussian Random Walk (GRW) which models the voting intention by assuming (1) voting intention on any single day only varies a little from the day before, (2) the polls are a noisy indication of population voting intention, and (3) individually pollsters have systemic biases but collectively across all pollsters the polls are unbiased. This is the same model I have used in past elections. It is also my preferred model. At the moment it shows Labor two-party preferred (2pp) voting intention at 50.7 per cent.
The second model I run - a Gaussian Random Walk with a Left Anchor (GRWLA) - augments the first model by anchoring the hidden voting intention to the result at the last election. By imposing a left anchor, I am assuming some things: First, that any honeymoon effect after the election is consistent with my assumption of minimal voting intention change from day to day. Second, that pollsters retain the same methodological approach from the time of the last election. I am not convinced by either of these assumptions. At the moment it has Labor's 2pp voting intention at 49.2 per cent.
The third model I run is a Gaussian Process (GP) model. Rather than model hidden voting intention on every day, it only models hidden voting intention on polling days. The model assumes that the hidden voting intention for polls that are nearby in time will be more correlated than for polls that are further away in time. This relationship between polls based on their temporal distance from each other is expressed mathematically in the model using an exponentiated quadratic kernel. Like the above models, this model also makes adjustments for systemic pollster biases. At the moment it has Labor's 2pp voting intention at 50.3 per cent.
I am still exploring this approach, however, it is sensitive to where the "mean" across the data points is set (with a strong tendency to mean reversion at each end of the series, and for periods through the series where there are few polls). I have set the mean to the average of the last 10 polls.
We can compare the central tendencies of these approaches as follows. You will note the "mean reversion" evident in the early part of the GP series.


No comments:
Post a Comment