Monday, November 25, 2024

Update: betting market and opinion polls 25 November

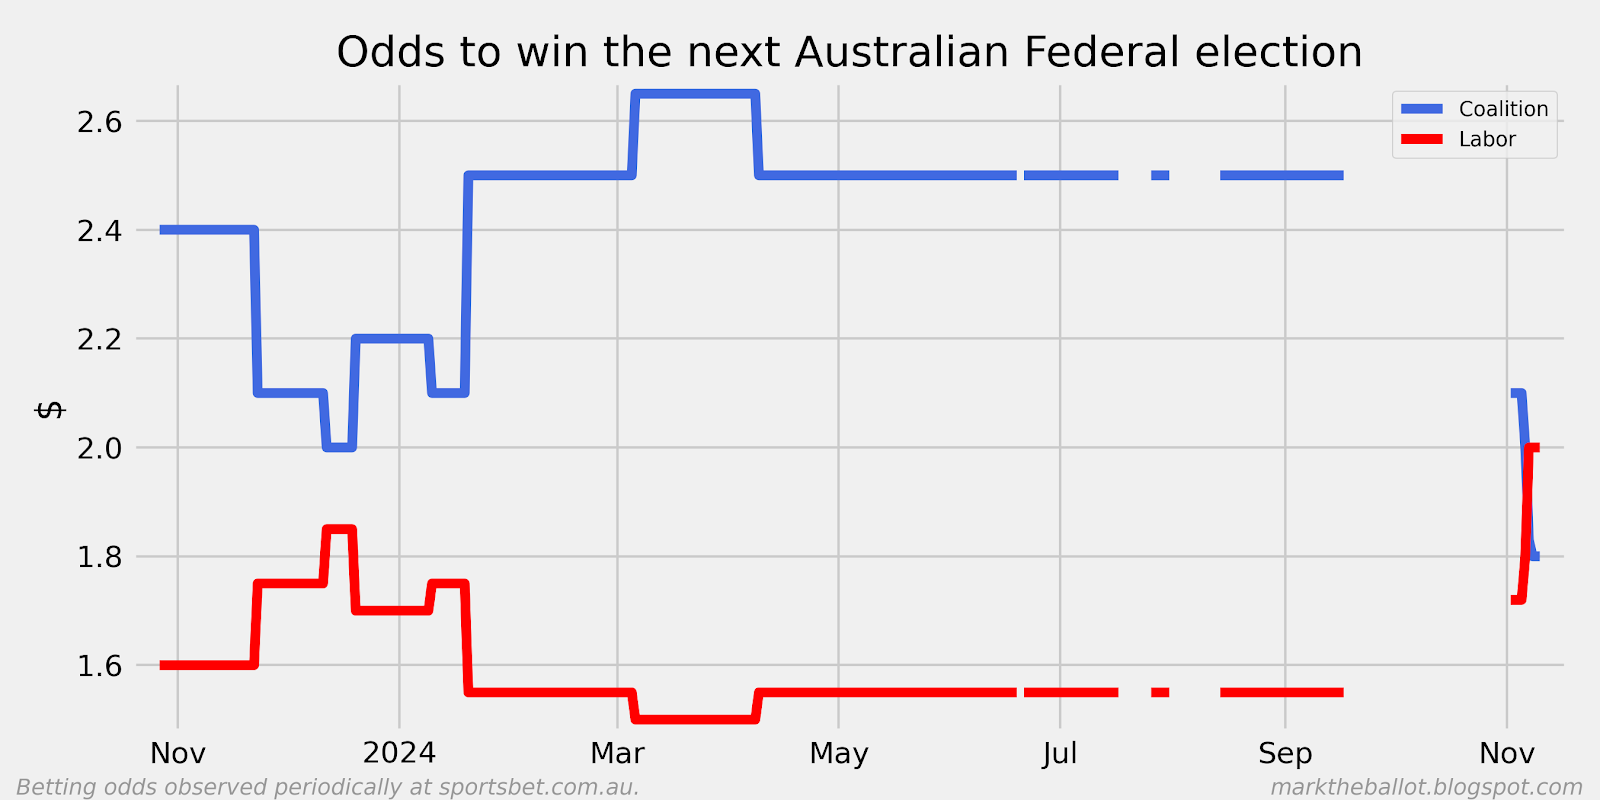
In the days following the Trump win in the United States, the betting market for the Prime Minister's party after the next Australian Federal election was a little volatile. It appears to have settled with the Coalition as slight favourite (55% probability). This reverses the position of the two major parties immediately prior to the US election. 


Apologies for the gaps in the previous charts. For various reasons I was not able to capture the odds data every day. The continuous lines represent consecutive days on which I was able to collect odds.

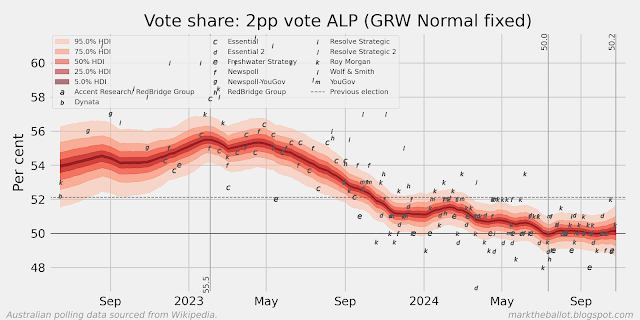
The two-party preferred voting intention polls now have the Coalition ahead (on average). However, given the likely number of independents and minor parties in Parliament after the next election, it is a little difficult to be confident about the major party to form government. 


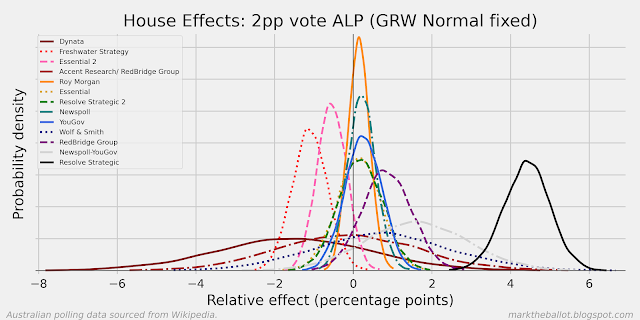
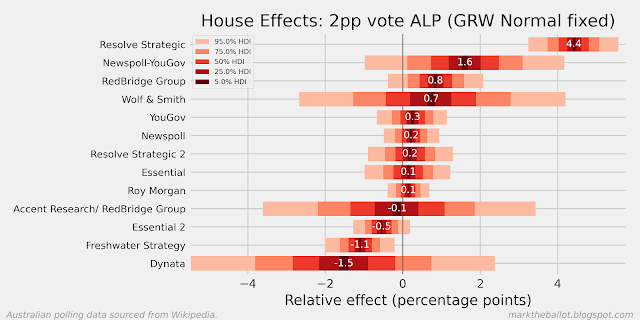
The estimated house-effects that arise from Gaussian Random Walk (GRW) Bayesian Aggregation above are as follows. Note: these two charts are reporting on the same underlying data. 


Turning to the primary voting intention, we can see some clear trends. The Coalition has improved its position while Labor has declined since the last election.


The ALP is below where it was at the last election. Labor would likely lose seats to the Coalition, the Greens and/or left-leaning independents, if the election reflected these poll results. 


The Coalition is ahead of its previous election performance, and should gain both Labor and perhaps independent seats at the next election. 


The Greens should either maintain their position or gain seats at the next election.


The independents will either maintain their seat count or lose seats at the next election (based on these poll results).


The attitudinal polling shows a remarkable shift in sentiment for a first-term government.


Monday, November 11, 2024

New polls: Newspoll and Resolve

Today's Australian had a new Newspoll (49-51 in the Coalition's favour), and the Fairfax media had a new Resolve Strategic Poll (50-50). All of my polling aggregation methods suggest that the Coalition is just ahead in the two-party-preferred voting intention metric. However, the only certainty is a hung Parliament. In this range, it is just too close to call. 


Note: in the charts above, the GRW model is a Gaussian Random Walk model where the vote-shares on any day and much the same as the vote shares on the day before. The GP model is a Gaussian Process model, where polls that are closer together in time are deemed to be more highly correlated. The GP model performs less well when the density of polling data is low (as with the first year of the series above), and at both ends of the series where it tends to revert to an underlying assumption about voting intention in the model (set to an average of the most recent 10 polls). I prefer the GRW model over the GP model. 

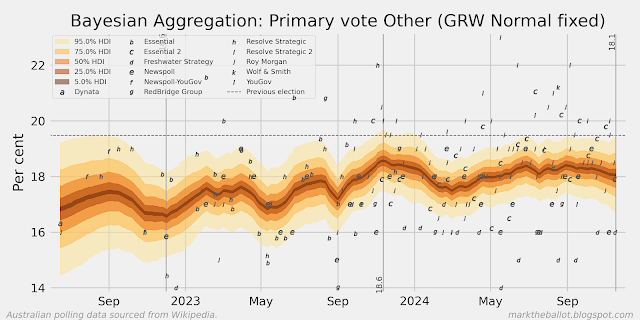
The primary votes are also moving around a little, with the major party votes up on recent trends, at the expense of the Greens and other minor parties.


The betting market sees the next election as pretty close to the proverbial toss-up, with the Coalition the favourite to form Government.  The gaps in the following charts are days in which I did not collect odds data from SportsBet.


Monday, November 4, 2024

Update: opinion polls and betting market

Before I begin, let me tell you a sad story. I went overseas for an extended period, and while I was away, the code I use to daily scrape the SportsBet website stopped working. So, I have a roughly six-week gap in the betting market data. In this time, the odds of a Labor victory have lengthened (with Labor still the favourite to form government after the next election). The betting market has the outcome of the next election pretty close to even money (reflecting the polls below). What has changed is the odds for any other result (which I ignore in the following charts). Those odds have shorted from \$101 to \$81. 


Turning to the opinion polls, we now have an extended period of some four or so months where the projected two-party preferred outcome is very close to 50-50 - the proverbial toss-up. 


At this point, I should note the way in which I model house effects has changed. For those pollsters that have changed their polling methodology (Essential and Resolve), I exclude the polls conducted under the earlier methodology from the requirement that all house effects sum to zero across the pollsters. I also exclude from the sum-to-zero constraint those pollsters that have fewer than five polls published over this period. For the record, the pollsters included in the sum to zero constraint above were: 'Newspoll', 'Resolve Strategic 2', 'Freshwater Strategy', 'Essential 2', 'Roy Morgan', 'YouGov', and 'RedBridge Group'. The estimated house effects for each pollster are as follows (note: these two charts are different ways of reporting exactly the same data).


Turning to the primary votes, some trends are clear. Labor's primary vote is down on the previous election and the Coalition's primary vote is up. The vote share for independents and other parties is down on the previous election. The vote share for the Greens is above where it was at the previous election.  I suspect this reflects some movement from the "Teals" back to the Coalition, and some movement of votes from Labor to the Greens. On these numbers, you would expect whichever major party forms government, they will rely on the support of others for the passage of legislation (yes, the polls suggest a hung parliament).


And for completeness, the attitudinal polling follows.


As usual, if you want to see how the charts were made: click here.

The data for these charts was sourced from Wikipedia.