The polls have tightened in the last week of the 2022 Australian Federal Election campaign (albeit off a set of polls in early May that were more favourable to Labor than the late April polls).


The polls have tightened in the last week of the 2022 Australian Federal Election campaign (albeit off a set of polls in early May that were more favourable to Labor than the late April polls).
Recently in a conversation with Ethan from Armarium Interreta, he made the observation that the polls in the final week of a campaign were (on average) more accurate than the polls in the final two weeks of the campaign. This is critical because we are seeing a tightening in the most recent polls. [Note: things might not stay this way as more polls come in, but this is how it looks now].
.png)
Most of my refinements since yesterday's post have been to correct minor glitches in the code, and data transformations to make it work better with the Hamiltonian Monte Carlo method that is used in the PyMC software. But in broad terms the model is conceptually unchanged.
UPDATE: unfortunately there were glitches in my code from yesterday. I have now corrected these and updated the charts: here. Yesterday's post (with the errors) follows.
Two polls were released in the past 24 hours. Ipsos has Labor on 57 to 43 per cent of the two-party preferred (2pp) vote. A Labor win of this magnitude would be record breaking for Labor; the Coalition won 56.9 per cent of the two party vote in 1966 with a rally-to-the-flag election on Australia's participation in the Vietnam war.

Newspoll has Labor well ahead with 54 to 46 per cent of the 2pp vote. If this was repeated at the election, Labor would have a comfortable win.
The aggregate polls show a movement to Labor over the past week.


With the latest Ipsos poll, any concerns I might of had about the polls being in a narrow range (collectively) are no longer there. I cannot use the Chi-squared statistic to reject the null hypothesis that the polls (collectively) have the expected variance. Collectively, the polls are not under-dispersed.

Note: This page has been updated. Unfortunately, I found some errors in my original calculations.
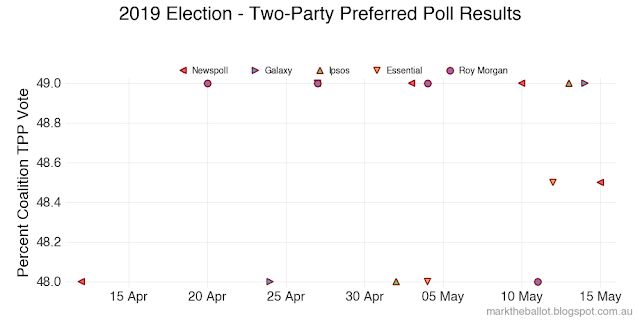
On twitter, I observed that the most recent 6 polls were in an unusually tight range. I calculate the two-party preferred vote share for Labor (working backwards from the most recent poll) as follows: Morgan 53.7, Essential 51.9, Newspoll 53.3, Resolve 53.9, Morgan 52.8, Newspoll 53.1.
I was alert (but not yet alarmed) because the under-dispersion in the 2019 polls prior to that Election suggested there was something wrong with those polls. The 2019 two-party preferred (2pp) voting intention polls (as published) were implausibly close together, all within a one percentage point range of 51 to 52 per cent for Labor (48 to 49 per cent for the Coalition). Using the Chi-squared statistic for these polls (1.68) , we can see that the probability of this happening by chance alone is less than 0.01 per cent. This Chi-squared statistic is on the very edge of the Chi-squared probability density distribution for 15 degrees of freedom. That is to say if the polls were truly independent of each other, we would only expect to see this absence of variance on average in less than one in every 10,000 elections.

There is a rule of thumb in statistics and machine learning known as the bias-variance trade-off. In essence this rule of thumb says that reducing the variance in model predictions (opinion polls are examples of a statistical model) tends to see an increase in errors attributable to statistical bias. The opposite is also true.

The
polls prior to the 2019 election had an implausible absence of
variance. After the election, we discovered they also had a substantial
bias, missing the final Election outcome by some 3.3 percentage points. As a result, not one pollster picked the eventual winner of the 2019 Election.


My concern will rise if we see further polls in a narrow range. If the absence of variance in the 2022 polls reaches 2-sigma (two standard deviations - 95.45 percent) I would be worried. If it reaches 3-sigma (99.73 per cent) I would be very worried. At 4-sigma (99.9937 per cent) ... things would still be better than the 2019 Election ... but I would be alarmed at the state of polling.
Update: Looking closer at the four pollsters that are tracking closely with each other since the election was called we are still not quite at 2-sigma for these polls.


The opinion polls continue to suggest that Labor has a sizeable lead over the Coalition in two-party preferred votes. The earlier movement to the Coalition appears to have stalled. If the election were held now, and assuming the polls are both accurate and unbiased on average, Labor would be 6.6 percentage points of the Coalition in the final count. This would give Labor a comfortable victory. The Coalition's only hope is that this election sees a repeat of the polling error that we saw in 2019.


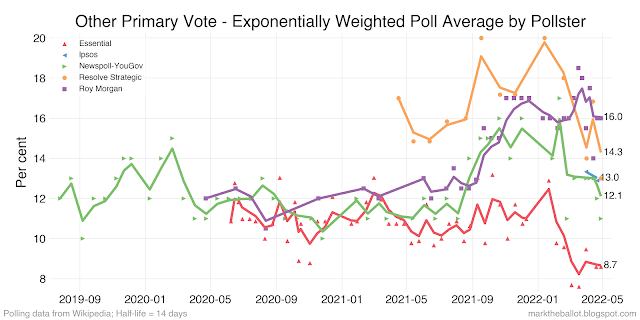
The Primary Vote aggregations follow.


When you look at the two-party preferred (2pp) election outcome compared with the cloud of 2pp polls immediately prior to an election, it looks like the election result, more often than not, is more favorable to the Coalition than the preceding polls. To put it another way, it looks like the polls on average favour Labor. In the following chart, the election result (in the red/orange box), is typically above most of the polls (blue dots) in the five weeks immediately prior to an election.

If we look specifically at the average of all the 2pp polls in the 14 Federal elections from 1983 (the modern polling era), the Coalition outperformed the final two-week poll average 12 times. Labor outperformed this poll average twice. The following table has the difference between the average 2pp poll for the two weeks prior to the election, and the final 2pp Election result. A negative number indicates the final fortnight polls were on average more favourable to Labor than the election result. A positive number indicates that the polls were more favourable to the Coalition than the election result.
| Election Year | Ave Poll Error (for polls concluded in the final 2 weeks before the election) |
|---|---|
| 1983 | -1.300000 |
| 1984 | -3.400000 |
| 1987 | -2.316667 |
| 1990 | -1.466667 |
| 1993 | 1.618182 |
| 1996 | -1.941667 |
| 1998 | -0.087500 |
| 2001 | 0.100000 |
| 2004 | -0.877778 |
| 2007 | -1.500000 |
| 2010 | -2.192308 |
| 2013 | -0.455556 |
| 2016 | -0.327273 |
| 2019 | -3.270000 |
We can visualise this tendency to favour Labor in the polls as a probability density function, where the area under the curve sums to one. The statistical technique to construct this curve is known as a Kernel Density Estimate (KDE). It is clear, that on average, these polls collectively were a little over one percentage point favourable to Labor when compared with the final Election result.

The next long series of charts shows each of the elections and the way in which the rows in the above table were constructed. Feel free to skip past these charts if this is not your thing.


I have been thinking about whether I can model this bias, and whether I should model it. Using Bayesian techniques, I have found a Student's t-distribution that provides a good algebraic approximation of the probability density function above. So it can be modeled easily. For the nerdy, this distribution has a location of -1.255 percentage points (this is the historic pro-Labor bias), a scale factor of 1.44 percentage points, and 11.22 degrees of freedom.
.png)
I am more conflicted on whether I should model the pro-Labor bias. I have not found a compelling theory of action for how the historic bias arose. I assume that the pollsters would rather get the final election result correct (as this reflects well on their business), than to favour one side of politics or the other. It has also been reported to me that this bias does not exist in state government polling. I think this historical bias is unlikely to have occurred by chance alone. Nonetheless, if I don't know why it has occurred in the past, I cannot be confident that the driving factors will persist into the future.
I will think about this some more. If you have any compelling explanations for the historical bias, let me know in the comments below.
Finally, I want to thank Ethan and Rebecca at armariuminterreta.com who compiled this data. Ethan tells me that he in turn was assisted by William Bowe and Kevin Bonham.
