For the overall election result, we have seen a sizable drop in the Coalition's mean win probability, from 27.1 per cent yesterday to 24.6 per cent this morning. It is down from 29.2 per cent four days ago.

Turning to the Sportsbet odds on the individual seats, Labor is still well ahead. Since last week:
- The Coalition has moved ahead in Banks, Braddon, Dawson and Leichhardt.
- Labor has pulled ahead in Bass.


The 151 time-series charts for each seat follow. Because the bookmakers have such humongous over-rounds with their individual seat odds, I take a fairly savage approach with the long-shot odds.
- For odds between $1.01 and $1.02 (bookmaker raw probabilities between 98 and 99 per cent), I have treated the seat as having a probability of 100 per cent for the favourite.
- For odds between $1.03 and $1.50 (bookmaker raw probabilities between 66.7 and 97 per cent), I have done all of the normalisation for the bookmaker's over-round in terms of the non-favourite parties.
- For odds in excess of $9.99, I have simply ignored them.


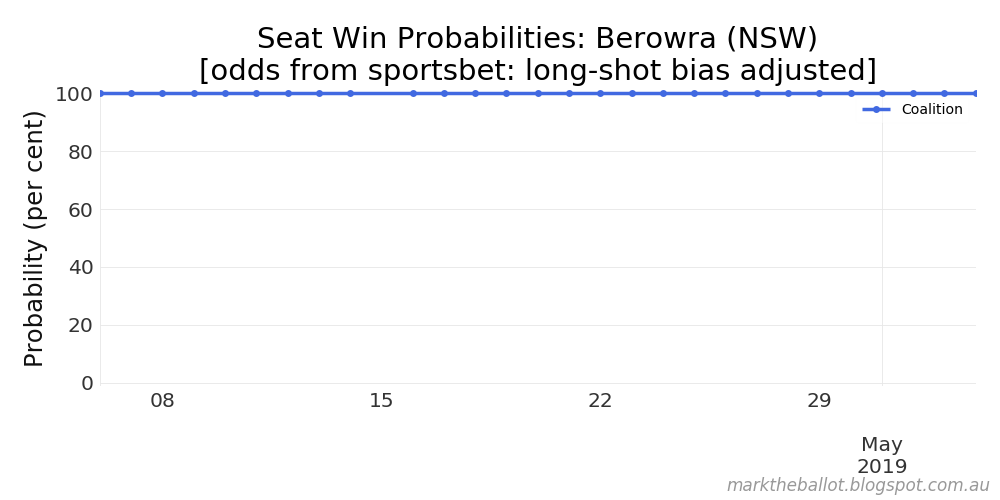


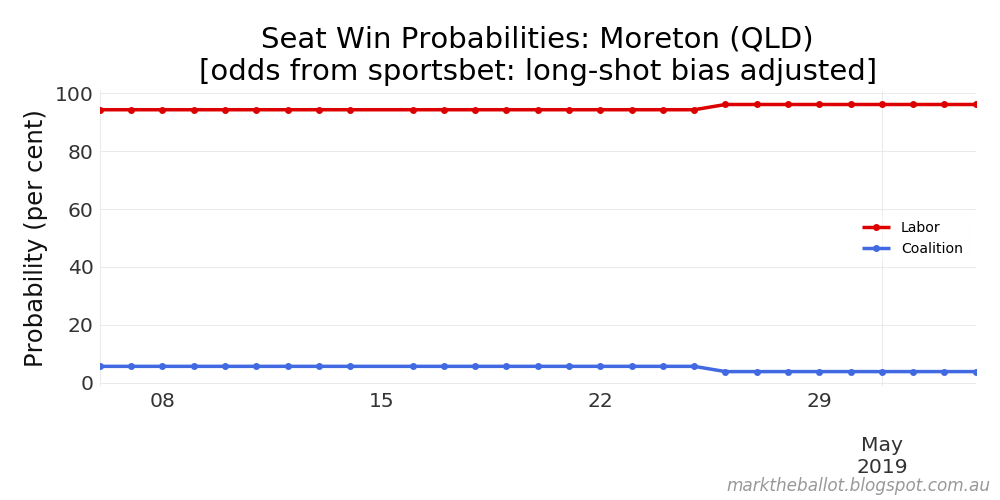

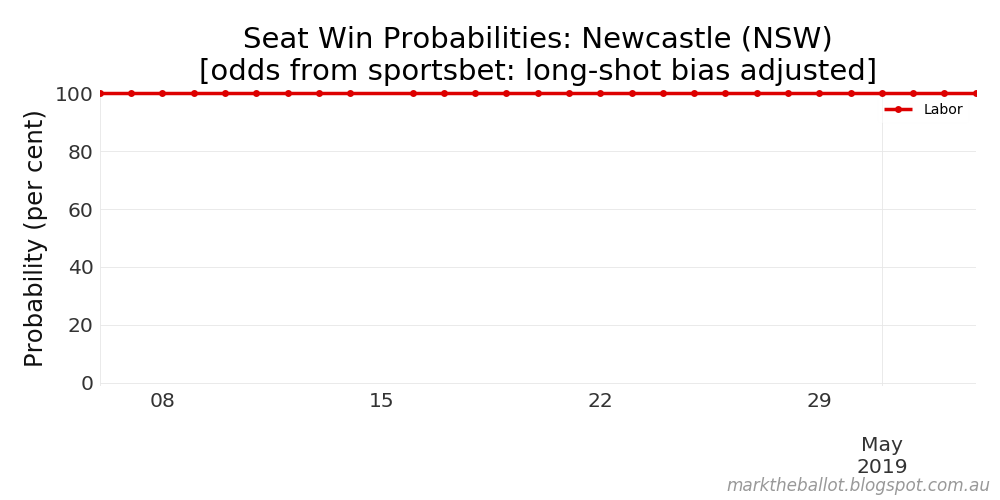


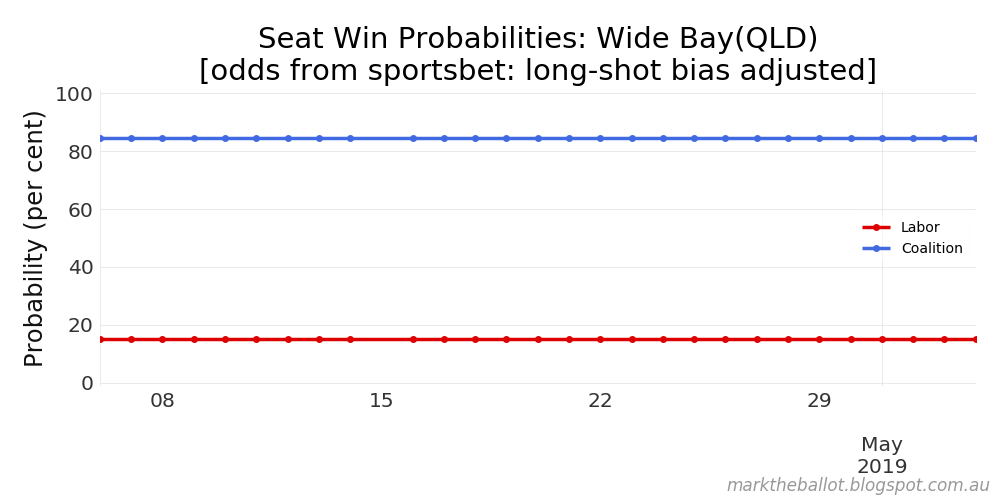


The most recent probabilities can be viewed as follows.

A Monte Carlo simulation using the above probabilities sees Labor winning government in their own right in 99.8 per cent of the simulations. There are no simulations where the Coalition achieved majority government.


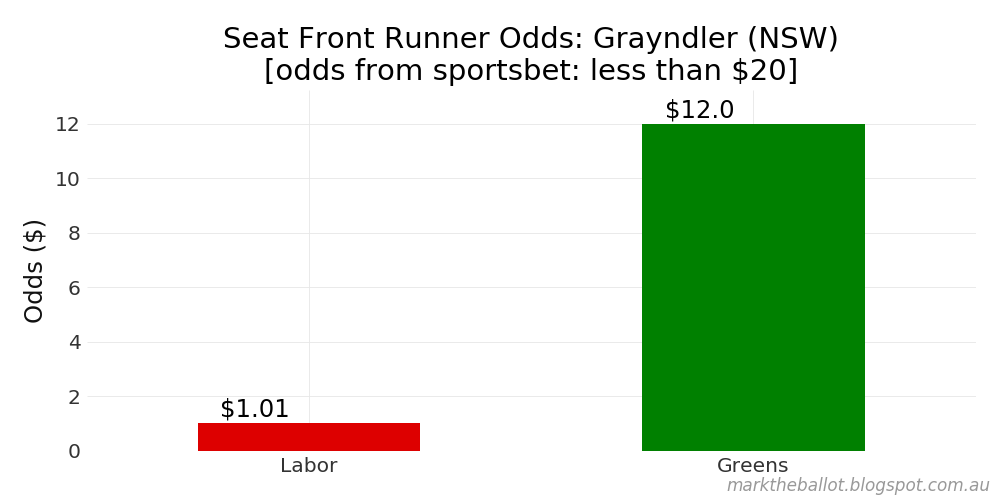
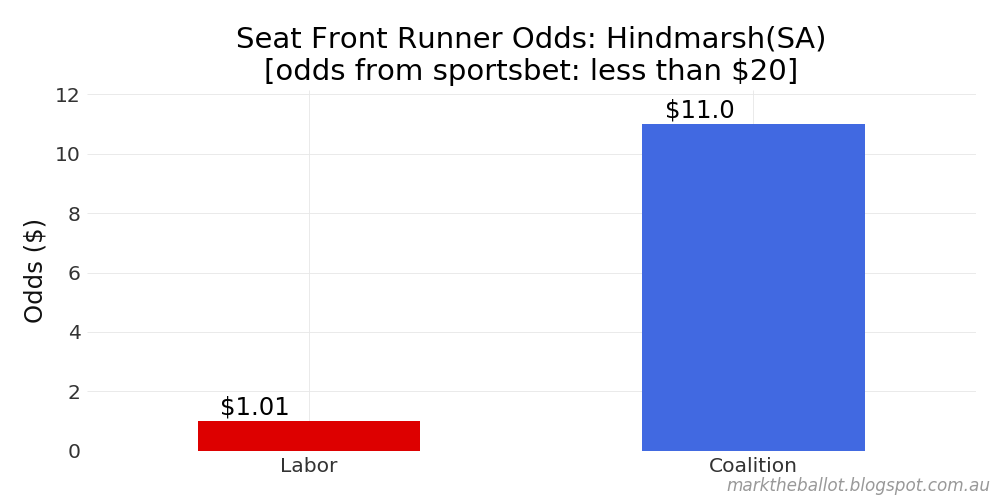
And, in what is a fairly frivolous set of charts, these are the odds I collected at 8:53am this morning. I have included all odds under $20, so I am being a little more inclusive than the probability charts above.


By and large, whatever statistics you might use: RMSSD, serial correlation, runs tests, trend analysis, sign tests etc., (for 800 polling periods 1992-2019, and 12 different pollsters), there does not seem to be much reason to suspect "rogues" -that is something outside the bounds of probability, which I would set at .001 for such a set of numbers.
ReplyDelete