This is more fuel for the improbability drive. My current working hypothesis is that the pollsters are doing one or more of the following (and noting that each pollster could be doing something different):
- augmenting their statistical model with a data analytics model to produce their TPP result
- reporting a rolling average over multiple polls
- polling the same online cohort each time
- polling something like ten times the sample they are reporting, and/or
- copying each other
Anyway, putting aside my doubts, and assuming the polls are actually normally distributed around the population-wide TPP voting intention, the best guess at this voting intention is the Coalition has 48.3 per cent of it to Labor with 51.7 per cent. If this is the case, Labor would win the election.

The adjustments made in the model for polling house biases follow.

The ensemble of moving averages lines up with this result.

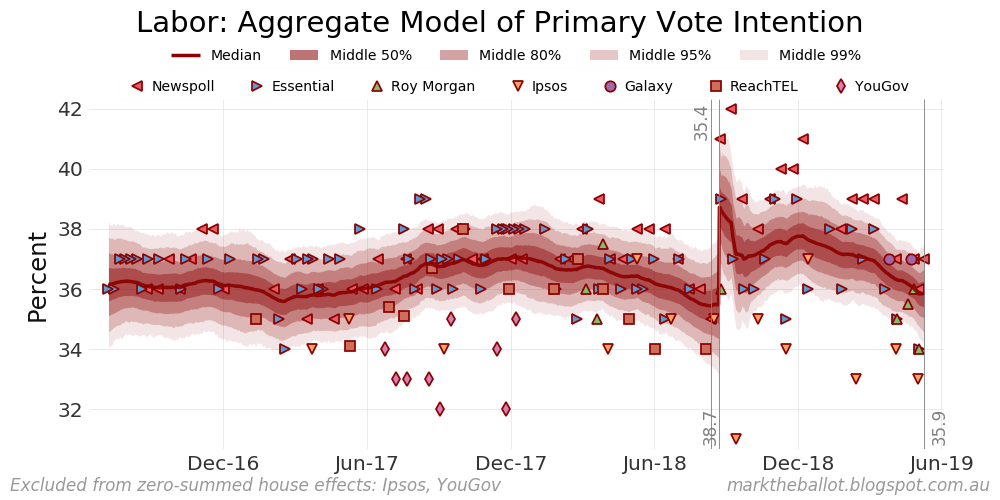
For the primary votes, we have the following charts.


Mark,my perception is there are less polls this time. for instance we have only Newspoll one week out from the election. I cannot remember that.
ReplyDeleteCould less polls be a possibility for the 'herding'
Definitely fewer polls and fewer polling companies. But this should not cause herding
DeleteThere is another possibility. Building the sample from an aggregate of sub-samples, where each sub-sample is taken from a division of the population, and the size of each sub-sample is in the same proportion to the total sample size that the sub-population bears to the total population.
ReplyDeleteOne way they could do this is on voter occupation. So if teachers are 3% of the population, they select 3% of the sample to be teachers.
This would reduce the variance because occupation is strongly correlated with voting. The population mean of near 50% results in a high variance (i.e. var = npq). But in some occupations, you can get 75% of the population voting the same way - and when such a sub population is sampled, the sub-sample variance is reduced because we are not near 50%.
The Essential Report used to constantly disclose that they were using a rolling 2 week average for their polling, for example:
ReplyDeletehttps://www.essentialvision.com.au/federal-politics-%e2%80%93-voting-intention-127
"The data in the above tables comprise 2-week averages derived from the first preference/leaning to voting questions."