Note: This page has been updated. Unfortunately, I found some errors in my original calculations.
On twitter, I observed that the most recent 6 polls were in an unusually tight range. I calculate the two-party preferred vote share for Labor (working backwards from the most recent poll) as follows: Morgan 53.7, Essential 51.9, Newspoll 53.3, Resolve 53.9, Morgan 52.8, Newspoll 53.1.
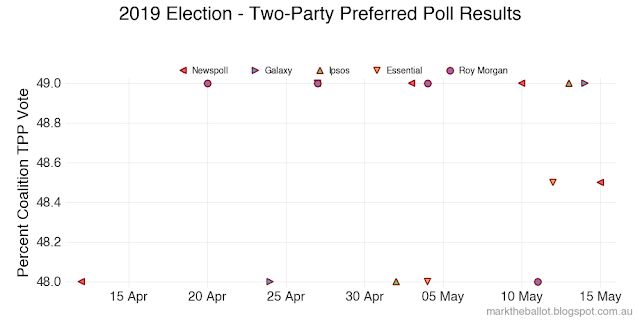
I was alert (but not yet alarmed) because the under-dispersion in the 2019 polls prior to that Election suggested there was something wrong with those polls. The 2019 two-party preferred (2pp) voting intention polls (as published) were implausibly close together, all within a one percentage point range of 51 to 52 per cent for Labor (48 to 49 per cent for the Coalition). Using the Chi-squared statistic for these polls (1.68) , we can see that the probability of this happening by chance alone is less than 0.01 per cent. This Chi-squared statistic is on the very edge of the Chi-squared probability density distribution for 15 degrees of freedom. That is to say if the polls were truly independent of each other, we would only expect to see this absence of variance on average in less than one in every 10,000 elections.

There is a rule of thumb in statistics and machine learning known as the bias-variance trade-off. In essence this rule of thumb says that reducing the variance in model predictions (opinion polls are examples of a statistical model) tends to see an increase in errors attributable to statistical bias. The opposite is also true.

The
polls prior to the 2019 election had an implausible absence of
variance. After the election, we discovered they also had a substantial
bias, missing the final Election outcome by some 3.3 percentage points. As a result, not one pollster picked the eventual winner of the 2019 Election.

Returning to the 2022 Federal Election, we are currently only looking at a collection of six polls, where the absence of variance has a one in five probability of occurring by random chance. At this point I am not concerned, but I am watching closely.

My concern will rise if we see further polls in a narrow range. If the absence of variance in the 2022 polls reaches 2-sigma (two standard deviations - 95.45 percent) I would be worried. If it reaches 3-sigma (99.73 per cent) I would be very worried. At 4-sigma (99.9937 per cent) ... things would still be better than the 2019 Election ... but I would be alarmed at the state of polling.
Update: Looking closer at the four pollsters that are tracking closely with each other since the election was called we are still not quite at 2-sigma for these polls.


great post as usual
ReplyDeleteWhat are you using as the expected value for each of these poll results to calculate the chi-square value? Is it the previous poll result or a moving average of poll results?
ReplyDeleteThis narrow variance is quite odd when you also consider that the variance for the "other party" vote is quite high. As the variance = np(1-p), one would actually expect a higher variance for values near 50% (such as the 2pp), and a lower variance for values near 15% (such as the other party vote).
ReplyDeleteI have heard anecdotal stories that suggest the kind of demographics that were under-sampled in 2019 are similar to the demographics that are voting "other" this time around. Perhaps only some pollsters have fixed the issue since, i.e. the ones with the higher "other" %?